Kɾαȥē Mike Profile picture
IT|Finance- Pro Trader - 20 yrs trading Stocks, Forex, Gold, Options, and now #Bitcoin, #NFTs, & #Altcoins - @cz_binance & @Binance follows me - #Honored
Sep 29, 2021 82 tweets 38 min read
83/

As mentioned in 81/ the trend has changed and you saw/seeing the 100 Day MA to act as Support & the 50 & 200 act as Resistance(which is the existing $41K-45K trading range)
The MACD hasn't crossed back over the 0 line to return the daily trend back to an UPtrend but it will. Image 84/

What could happen, happened as mentioned in 82/. Today you are seeing a fight between Bulls & Bears to try and turn $41K Support back into Resistance as the RSI weakens & the MACD stay under the 0 line. Today is a critical day in traders decision making. To long or to short? Image
Jun 24, 2021 119 tweets 52 min read
22/

#Bitcoin
What a fun 3 days. If you enjoy Rollercoasters you're in the right place.

About that bad news: all the signals lined up and you saw the expected. The Histogram turned red & the MACD crossed;below the 0 line. This pushed the price to the next Support level of $28.8K Image 23/

Major Support turned into Resistance and price even fell to the next Support for 1 day but this is how the Market will fake you out. Shorts are not in-the-money (ITM) and neither are those who opened up Put Options. Image
Jun 9, 2021 117 tweets 51 min read
10/

In Technical Analysis, you will never be 100% accurate but being close is good enough. The drawings was a little off but any Analysis will always need to be adjusted.
Over the past few days we saw a breakthrough the Support but only to return above it. This is a 'Fakeout.' Image 11/

What's next?

#Bitcoin is still trading in between the Bollinger Bands and as the Bands contract and the Averages change you will have a breakout.

Good News:
More volume
RSI above 50
Histogram still positive

Bad News:
MACD lines below center line. Image
May 26, 2021 107 tweets 46 min read
#Bitcoin

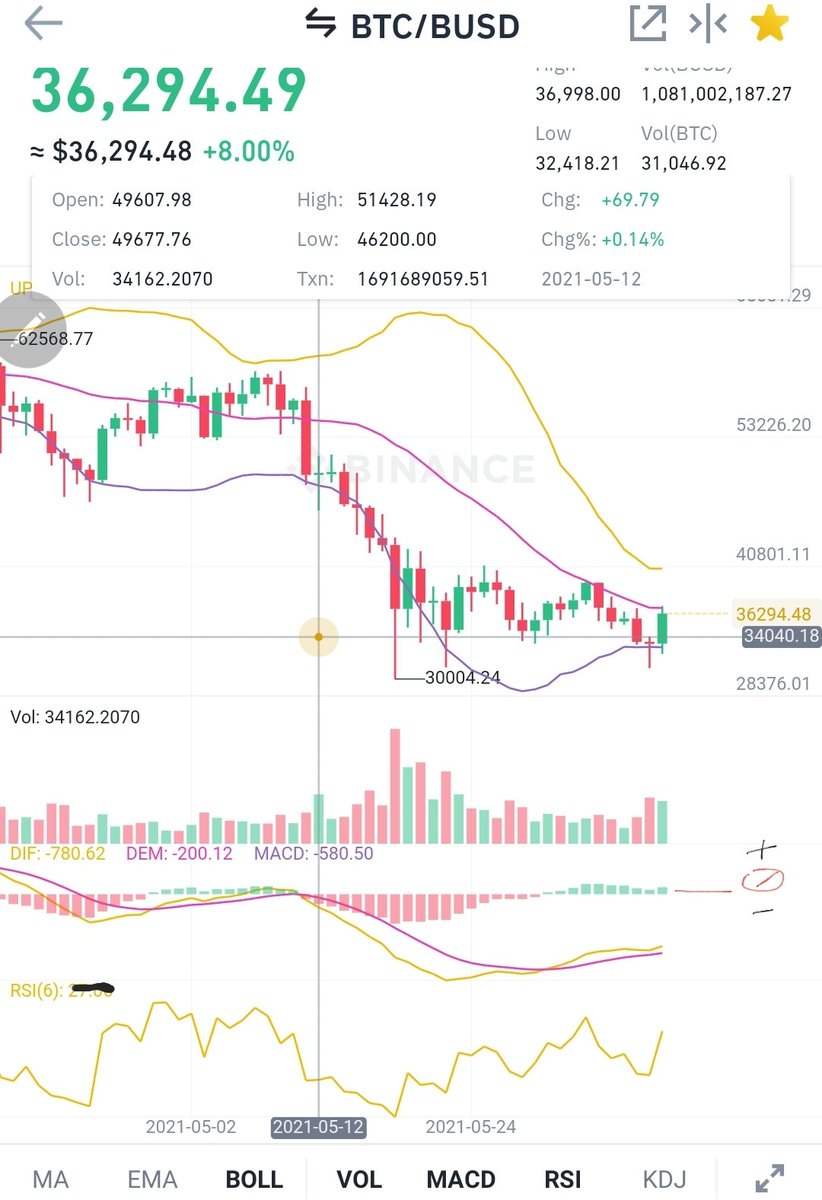
Over the next few 2-3 DAYS you will see the MACD lines possibly cross one another. It could also trend sideways as traders are expecting the 'cross.' If the MACD/Signal line cross expect a price surge to $45-50K.
Current Resistance is @ ~41K.
Major Support $34K

1/ Image 2/

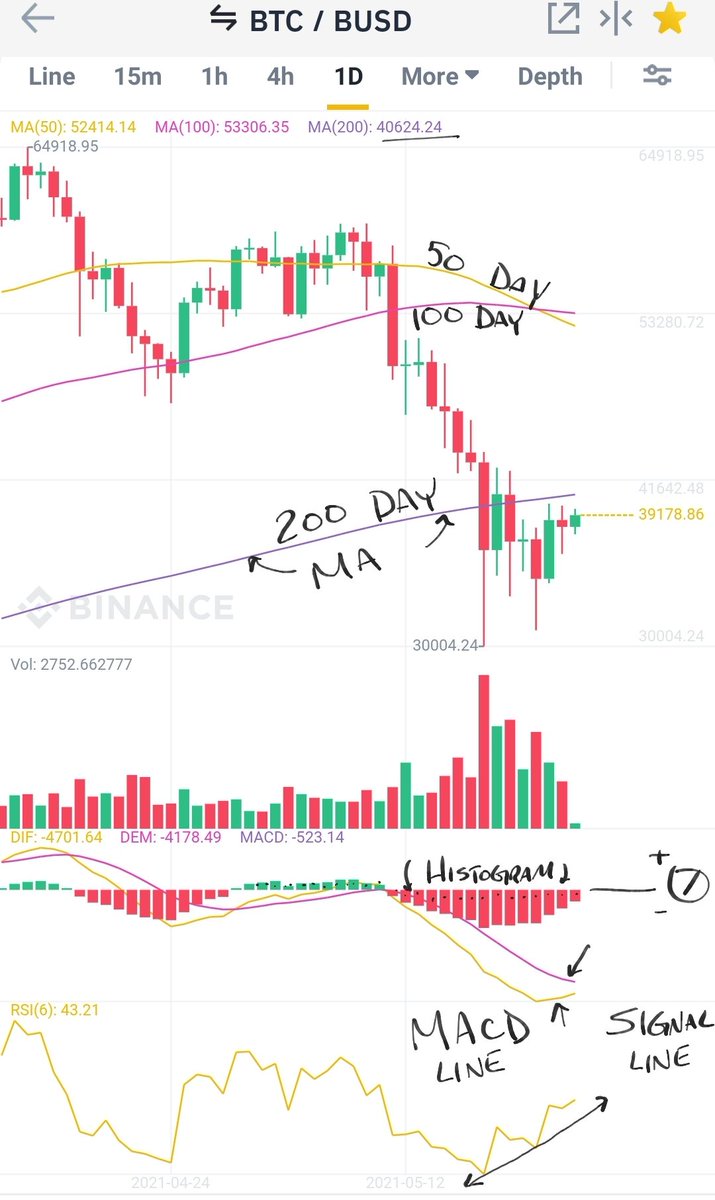
Over the next few days if #BTC price can close above the 200 Day Moving Average or MA you will see a price surge up near the 50/100 Day MA's.

Watch for the Histogram to turn Green or *Positive and watch for 'Fakeouts' as the MACD & Signal lines are both below the 0 line. Image