
1/ Global Tactical Cross-Asset Allocation: Applying Value and Momentum Across Asset Classes (Blitz, van Vliet)
"Momentum & value strategies applied to GTAA across twelve asset classes deliver statistically and economically significant abnormal returns."
papers.ssrn.com/sol3/papers.cf…
"Momentum & value strategies applied to GTAA across twelve asset classes deliver statistically and economically significant abnormal returns."
papers.ssrn.com/sol3/papers.cf…

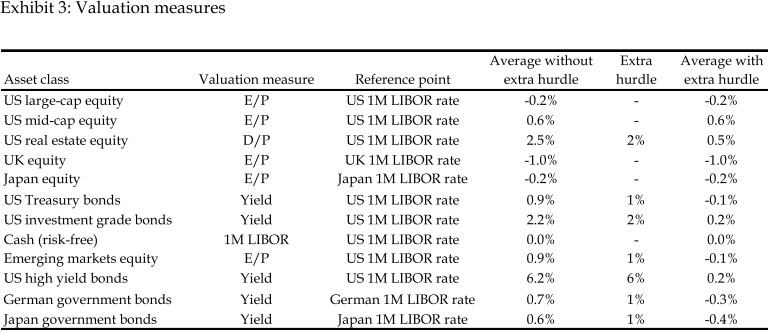
2/ "The starting point is simple yield measures. For equity assets, we use trailing E/P. For bond assets, we use standard yield-to-maturity. Both are adjusted for local risk-free rates. (For bonds, we are effectively taking the term premium as our valuation indicator.)"


3/ "We then apply asset-specific, fixed adjustments to yields. These were chosen such that the main structural biases towards certain asset classes are removed."
'Combined' rankings weight value by 50% and momentum by 50% (split equally between 1 month and 12-1 month momentum).
'Combined' rankings weight value by 50% and momentum by 50% (split equally between 1 month and 12-1 month momentum).

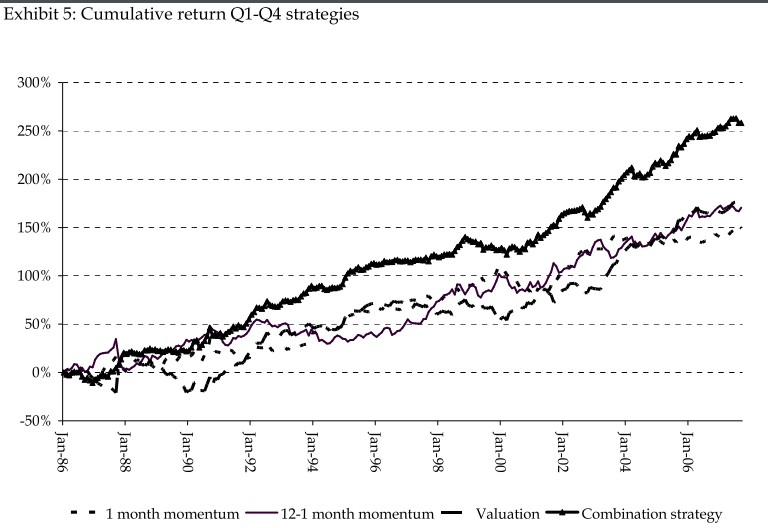
4/ "The two momentum strategies exhibit a positive correlation of 0.3 with each other and negative correlations of -0.1 to -0.3 with the value strategy.
"Given the correlations, it is not surprising that the combined strategy is superior to each of the underlying strategies."
"Given the correlations, it is not surprising that the combined strategy is superior to each of the underlying strategies."

5/ "The combined value-momentum GTCAA strategy does not have a large structural bias towards one specific asset class.
"We also calculate for each portfolio its average net exposure to each of the twelve asset classes (measured ex-post over the entire sample period).
"We also calculate for each portfolio its average net exposure to each of the twelve asset classes (measured ex-post over the entire sample period).

6/ "By subtracting the returns of these reference portfolios from the returns of the original portfolios, we adjust the latter for possible systematic biases towards certain asset classes. The Q1-Q4 return of the combination strategy remains at 11% with a t-stat larger than 5."
7/ "UMD can be mimicked with our cross-market 12-1 month momentum strategy. This is interesting: UMD is difficult to capture, as it involves frequent trading in hundreds of stocks.
"The α of the GTCAA combined strategy is robust to CAPM, 3-factor & 4-factor model adjustments."
"The α of the GTCAA combined strategy is robust to CAPM, 3-factor & 4-factor model adjustments."

8/ "The combined strategy survives a realistic level of transaction costs.
"It is likely that the return can be improved in practice using more sophisticated buy/sell rules or a portfolio optimization to trade off gross expected returns against transaction costs."
"It is likely that the return can be improved in practice using more sophisticated buy/sell rules or a portfolio optimization to trade off gross expected returns against transaction costs."

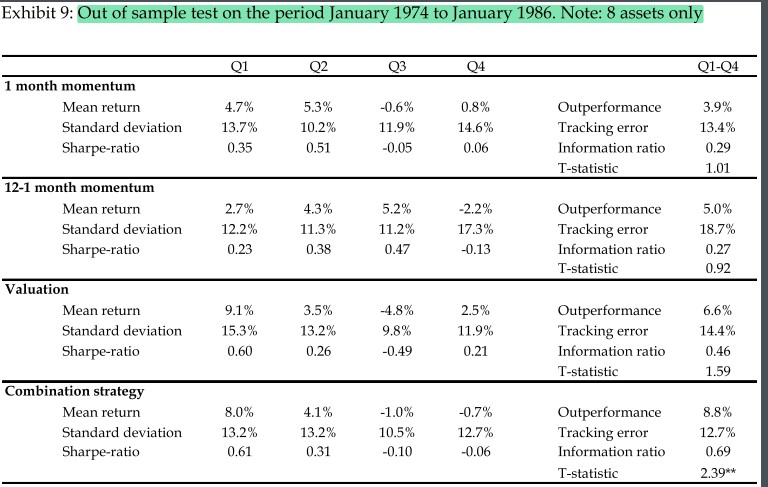
9/ "In a pre-sample test from January 1974 to January 1986, returns of the various GTCAA strategies tend to be somewhat lower but still strong. (Data for emerging equities, US HY bonds, German government bonds and Japanese government bonds are not available over this period.)"
10/ "We take for each asset its annualized volatility over the past 60 months and use this to lever or de-lever the position in that asset over the next month to an (arbitrary) target volatility level of 10%.
"The results are robust to this choice of volatility targeting."
"The results are robust to this choice of volatility targeting."

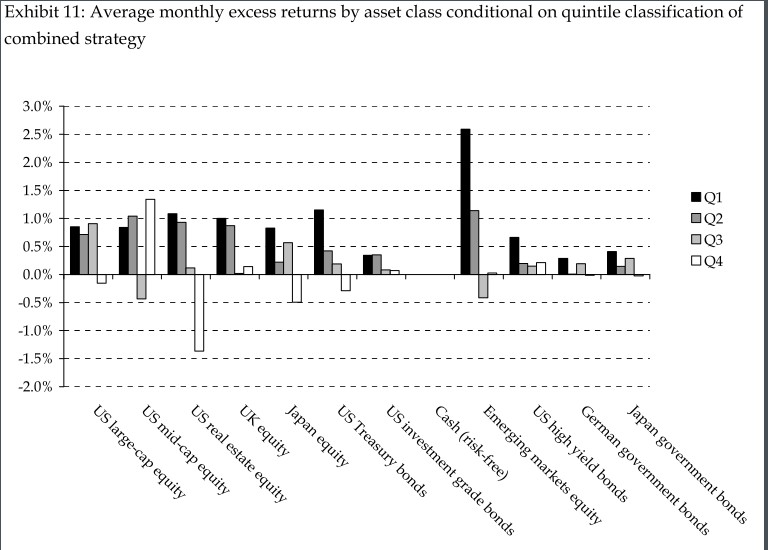
11/ "Most asset classes earn an average excess return of at least 0.3% (at most 0.2%) during months they are top (bottom) ranked, with a median of 0.8% (zero) across different asset classes.
"Valuation & momentum seem to be driven by all asset classes rather than only a few."
"Valuation & momentum seem to be driven by all asset classes rather than only a few."
12/ "We cannot rule out a risk-based explanation, but it seems unlikely.
"There is no evidence of increased risk for the high return top-quartile portfolio compared to the low-return bottom-quartile in terms of volatility, skewness and other measures (statistics not reported)."
"There is no evidence of increased risk for the high return top-quartile portfolio compared to the low-return bottom-quartile in terms of volatility, skewness and other measures (statistics not reported)."
13/ "Results are not consistent with a time-varying risk explanation of our results, as alpha spreads are positive in all states of the world."

14/ "We lack a solid theoretical framework for pricing a heterogeneous set of asset classes.
"Allocation decisions across classes tend to be made by end-investors such as pension fund boards & individuals.
"It is not hard to imagine mispricing arising at the asset-class level."
"Allocation decisions across classes tend to be made by end-investors such as pension fund boards & individuals.
"It is not hard to imagine mispricing arising at the asset-class level."

15/ "The returns of certain hedge funds may be related to our strategies. However, this is mainly driven by GTCAA 12-1 month momentum, which is strongly related to UMD.
"We even find a negative relation between the combined strategy & the aggregate CSFB/Tremont hedge fund index.
"We even find a negative relation between the combined strategy & the aggregate CSFB/Tremont hedge fund index.

16/ "Although some hedge funds may indeed be trying to exploit some of the cross-market allocation alphas documented in this paper, the overall results do not indicate that this is occurring at the large scale which would be needed to arbitrage away all these effects."
17/ Related reading:
Value and Momentum Everywhere
Superstar Investors
When Diversification Fails
Investing with Style
Value and Momentum Everywhere
https://twitter.com/ReformedTrader/status/1190258717779849216
Superstar Investors
https://twitter.com/ReformedTrader/status/1217884016797310976
When Diversification Fails
https://twitter.com/ReformedTrader/status/1348811451197136897
Investing with Style
https://twitter.com/ReformedTrader/status/1233573232881438720
• • •
Missing some Tweet in this thread? You can try to
force a refresh


