
Here's a basic tutorial for how to do simple linear regression in R!
(all in one thread?!)
#regression #Rstats #datascience #tutorial #ecology #Rthread #linearmodel #dataanalysis #statistics
[1/15]
(all in one thread?!)
#regression #Rstats #datascience #tutorial #ecology #Rthread #linearmodel #dataanalysis #statistics
[1/15]
First we are going to load some data. Let's use the built-in "trees" dataset by running:
data(trees)
This dataset is based on 31 black cherry trees trunks: their diameter at breast height (DBH) in inches (girth), height in feet, and wood volume in cubic feet.
[2/15]
data(trees)
This dataset is based on 31 black cherry trees trunks: their diameter at breast height (DBH) in inches (girth), height in feet, and wood volume in cubic feet.
[2/15]
Let's first rename the columns for clarity:
names(trees) <- c("DBH_in","height_ft", "volume_ft3")
[3/15]
names(trees) <- c("DBH_in","height_ft", "volume_ft3")
[3/15]
For the basic linear regression, we'll model the relationship between tree diameter (DBH) and tree height. We can actually write this out as DBH is a function of tree height, or DBH_in ~ height_ft (since you can read the '~' symbol as 'is a function of...').
[4/15]
[4/15]
Now, it's important to note that we are not drawing any conclusions about the causal relationship between DBH and tree height—the linear regression analysis simply allows us to test the correlation or association of these two variables.
[5/15]
[5/15]
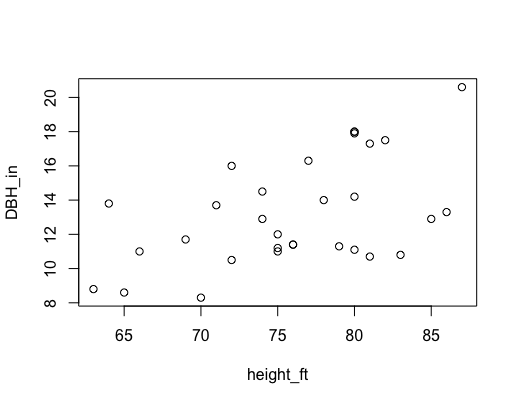
Before doing the test, we can visualize that relationship by first plotting what we want to model.
The neat thing is that we can write out what we did above, but using the plot function and add in an argument for the 'trees' data:
plot(DBH_in ~ height_ft, data = trees)
[6/15]
The neat thing is that we can write out what we did above, but using the plot function and add in an argument for the 'trees' data:
plot(DBH_in ~ height_ft, data = trees)
[6/15]
There appears to be a trend of increasing DBH with increasing height, but is that trend statistically significant?
[7/15]
[7/15]
To test this linear model, we will use the function 'lm()', and the syntax is actually exactly the same as our plot. But this time we will save the output into it's own object:
mod <- lm(DBH_in ~ height_ft, data = trees)
[8/15]
mod <- lm(DBH_in ~ height_ft, data = trees)
[8/15]
We can look at the output or results of this model by using the 'summary()' function:
summary(mod)
[9/15]
summary(mod)
[9/15]
First we can see the distribution of the residuals or the unexplained variance in our model: the min and max, quartiles, and median.
But then below that it gets more interesting...
[10/15]
But then below that it gets more interesting...
[10/15]
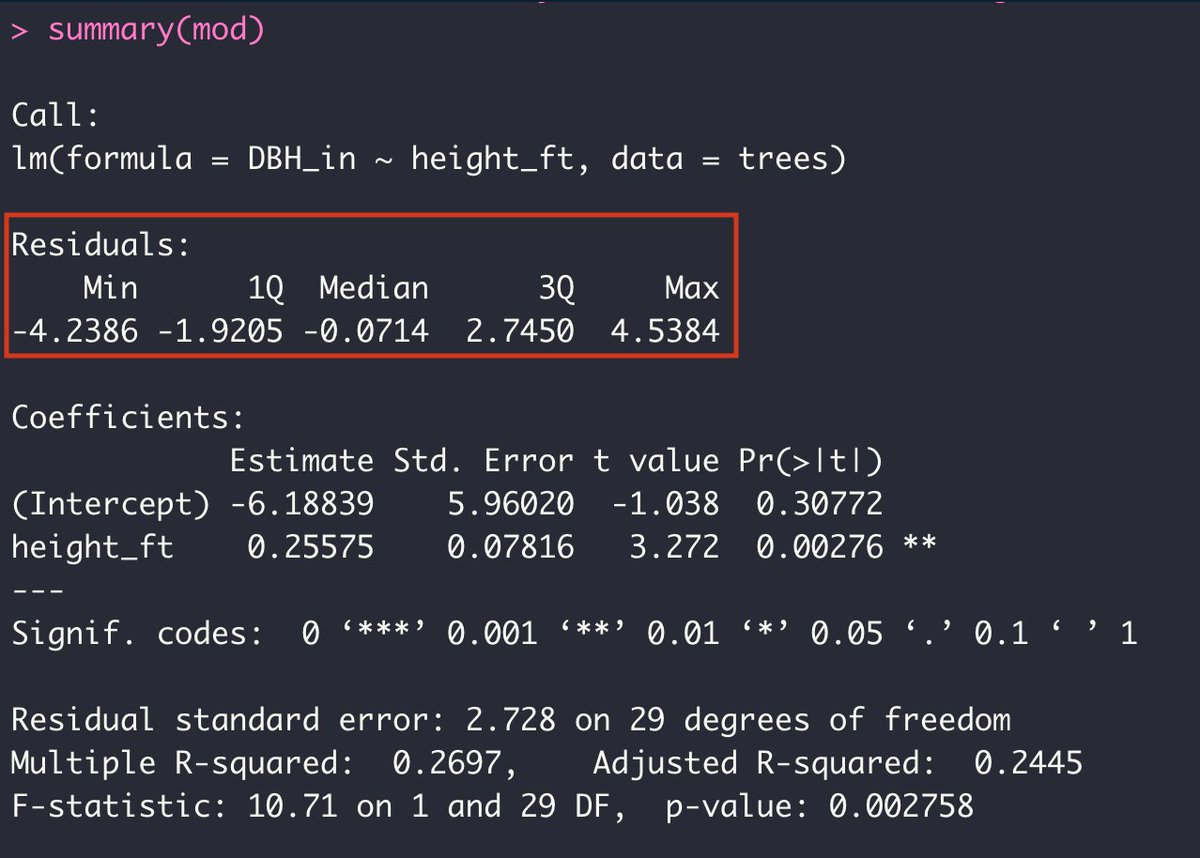
Remember that two coefficients get estimated from a basic linear model: The intercept and the slope. The equation for a line is Y = a + bX, and so the regression model attempts to find the 'a' and the 'b' coefficients that describe the line that best fits our data.
[11/15]
[11/15]
In the first column of the table we can see the estimate for each coefficient. Then we have the standard error of those estimates, then the test statistic, and finally, the p-value of each coefficient. The '*' help mark the significance levels of the p-values.
[12/15]
[12/15]

I'll leave the rest of the summary for a later tutorial ;) For now, I think it would be more fun (and useful!) to actually plot the fitted line onto our original scatterplot since the slope is significantly different from zero (the p-value is less than 0.05).
[13/15]
[13/15]
All you have to do is first run the plot function that we ran before:
plot(DBH_in ~ height_ft, data = trees)
and then run the function 'abline()' with the model as its argument. I also added in 'lwd = 3' to make the line stand out a bit more.
abline(mod, lwd=3)
[14/15]
plot(DBH_in ~ height_ft, data = trees)
and then run the function 'abline()' with the model as its argument. I also added in 'lwd = 3' to make the line stand out a bit more.
abline(mod, lwd=3)
[14/15]

And that's it for the basics of linear regression with R! Stay tuned for a video version of this tutorial coming soon. 🙌🎬. Let me know what you'd like to see next!
[15/15]
[15/15]
• • •
Missing some Tweet in this thread? You can try to
force a refresh


