Happy #ATBDay to all you #energytwitter nerds out there. Let's do a thread on how important the ATB and @NREL are. 1/16
The NREL Annual Technology Baseline, or ATB as the cool kids call it, is the only PUBLICLY accessible set of multiple generation tech FORECASTS for both PERFORMANCE and PRICING for GEOGRAPHICALLY SPECIFIC resources. It's also EDITABLE and TRANSPARENT. 2/16
PUBLIC DATA MATTERS - A lot of utilities use in-house or purchased generation tech data that are opaque and don't include all the financial assumptions ATB does. Here's onshore wind's assumptions. 3/16 

There was this one IRP I was working on where the utility claimed to use NREL's data. "Cool, then compare the LCOE's." Their wind/solar LCOE: $40-$50/MWh. NREL's ATB: $20's/$30's. Something was off. 4/16
The utility was double-counting inflation and adding some crazy adder fees on renewables that weren't listed *anywhere* in the IRP documentation. Public data helps uncover the IRP black boxes. 5/ 16
FORECASTS ARE VITAL - I know, folks love the Lazard stuff. I get it, it's nice, clean and clear. Even LevelTen has some great data on PPA's. But : those PPA's were prob signed 2 yrs ago. RE prices keep dropping. If you only use existing $, you're missing the future. 6/16
Everyone's like, "Oh, solar/wind prices can't get much cheaper." Well, they're wrong. And the ATB sees all. ATB projecting solar/wind CAPEX prices to decline maybe another 30-50% within 10 years. 7/16 


While installation prices decline, *performance* increases - so wind/solar have higher capacity factors, boosting more energy production, pushing levelized cost of energy even l o w e r. Solar CF's may reach in the 30%'s, and wind nearing 60% CF's within a decade. 8/16 


Those levelized costs of energy (LCOE's) are breaking below $20/MWh for wind and solar consistently by 2031 for both wind *and* solar. Dang. 9/16 


MAJOR ATB IMPROVEMENT: NREL takes recommendations on how to improve the ATB. Big improvement this year: Solar ~Classes~
Not all GEOGRAPHIES have same solar/wind resource, hence, classes. Last year we had to hobble together what Kansas City solar looked like. It was weird. 10/16
Not all GEOGRAPHIES have same solar/wind resource, hence, classes. Last year we had to hobble together what Kansas City solar looked like. It was weird. 10/16
Now: Ahhhh. A good solar resource can get 30%+ capacity factor (Class 1). A good wind resource can get 50%+ capacity factor (Class 1). Harmonization across the techs. 11/16 


ATB is *editable*. Don't like the ITC assumption of 0%? Cool. Change it. Let the macros figure it out. 12/16 

OH shizzle. ATB also includes solar+storage this year. That's a big deal. Now there's zero, zero reason for any utility to not model it in their IRP's. 13/16 

The ATB 2021 also includes improved clarity on battery storage!!!! Standardized *language* around this "new" industry is key for resource planners (and advocates) to discuss specific data inputs for IRP's. Vital! 14/16 

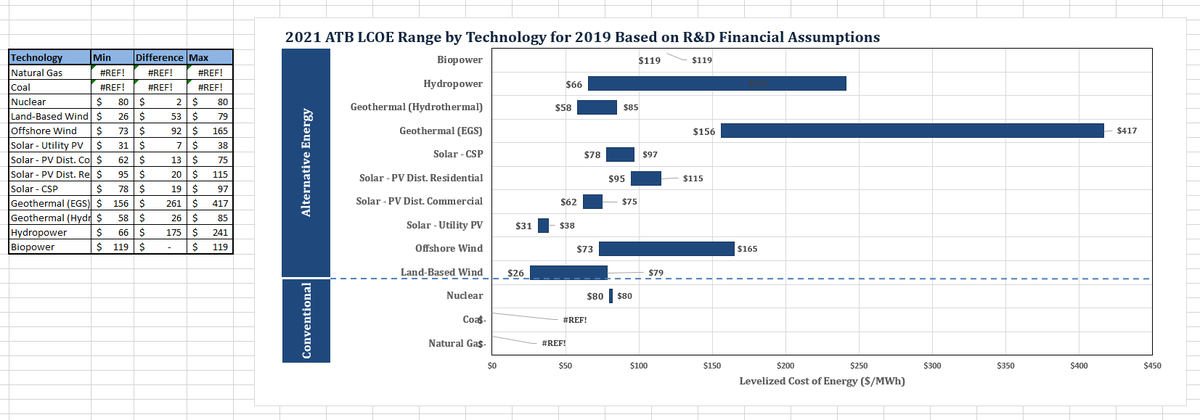
Of course, ATB isn't perfect. Here's their native LCOE chart...it, needs some love. But you know what? You can go into the spreadsheet and find the data.
That's T R A N S P A R E N C Y that is unmatched 15/16
That's T R A N S P A R E N C Y that is unmatched 15/16

From the bottom of #energytwitter's heart, thank you to the TEAM of folks at @NREL that provide this FREE SERVICE to all of us. We depend on you. Otherwise our energy world would be much, much darker place. 16/fin
@NREL @threadreaderapp
unroll
unroll
• • •
Missing some Tweet in this thread? You can try to
force a refresh


