Odds are, most will capitulate in the next 4 weeks if $SILVER decides to do the standard final flush before the big summer rally. It's happened before, it can happen again.
Look at 2005, 2006, 2010.
🧵
$GOLD #GOLD #SILVER $GLD $SLV $DXY $SPY $VIX $GDX $GDXJ $SILJ $DXY $USD
Look at 2005, 2006, 2010.
🧵
$GOLD #GOLD #SILVER $GLD $SLV $DXY $SPY $VIX $GDX $GDXJ $SILJ $DXY $USD
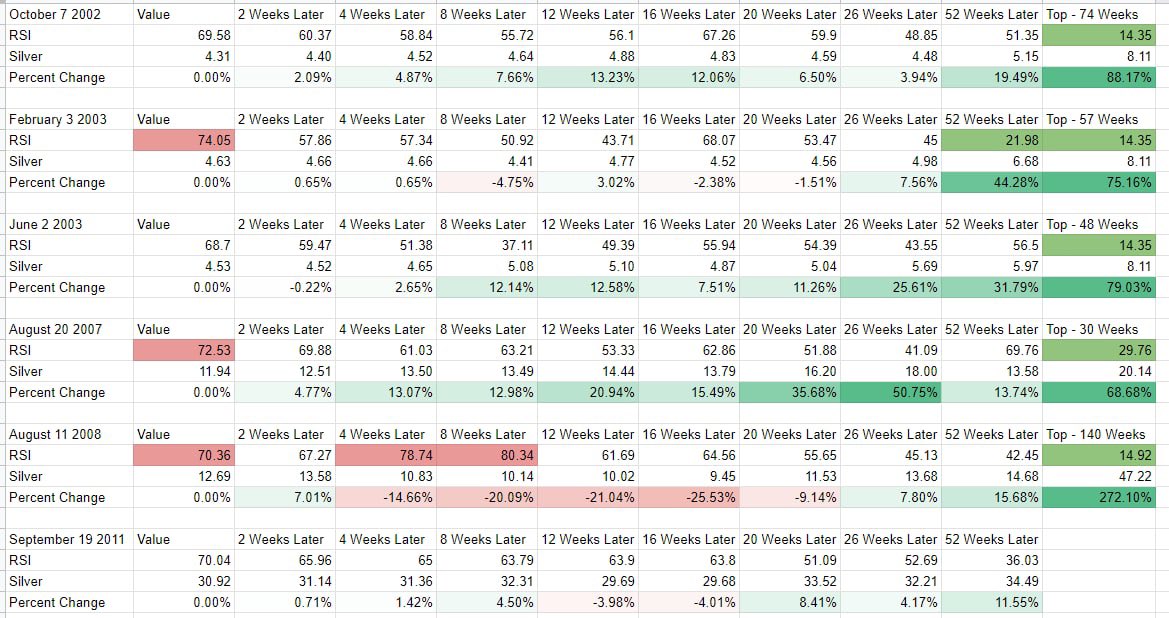
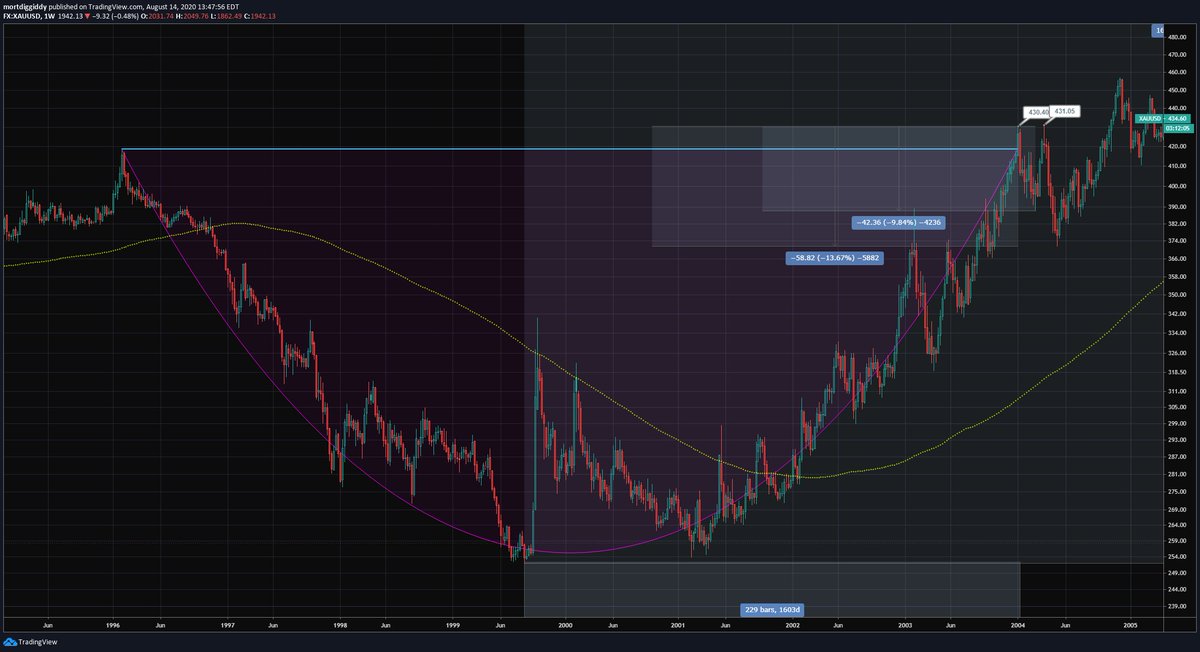
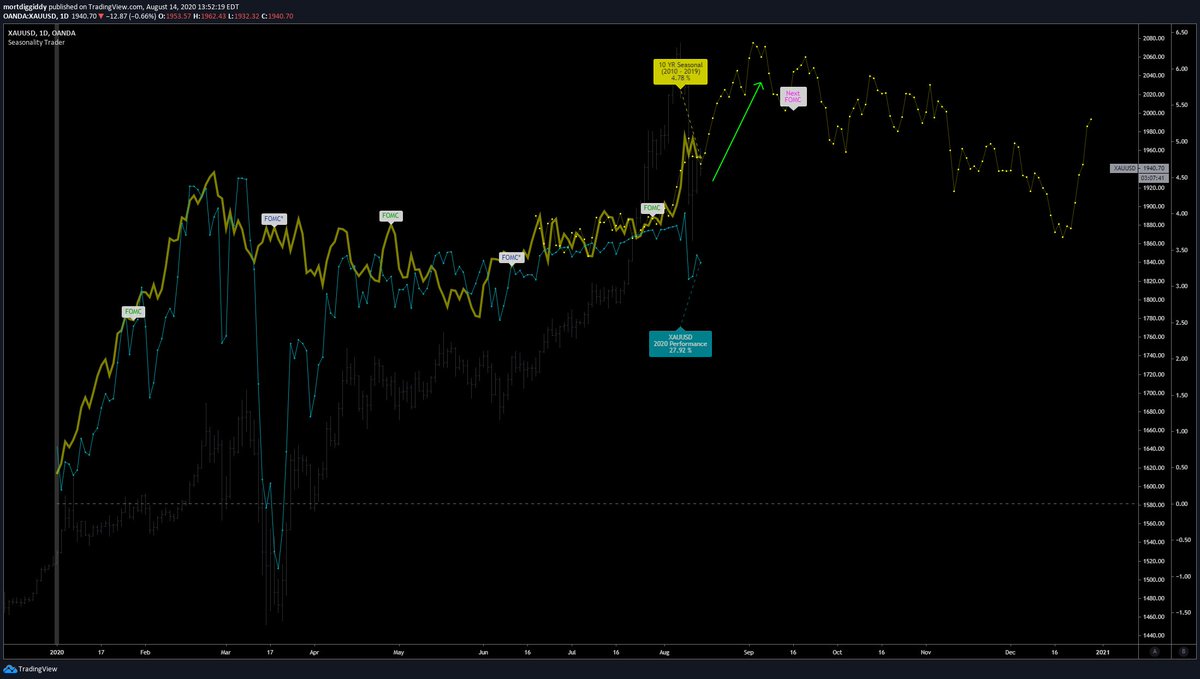
Typically gold and silver begin their summer rallies in June/July and last until late August to early September. 2020 was a good example of this.
https://twitter.com/dailyEdgeGroup/status/1407178815575523329?s=20
US Dollars in post election years and years ending in -1 typically have a major top in the first half of July and descend into October.
https://twitter.com/dailyEdgeGroup/status/1407178815575523329?s=20
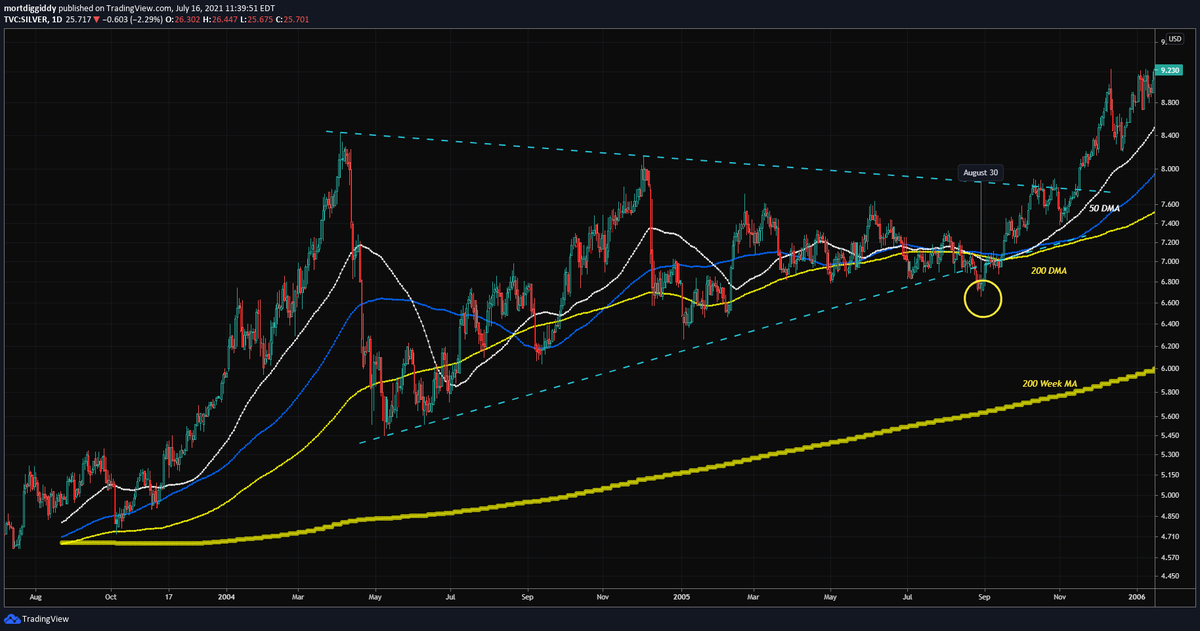
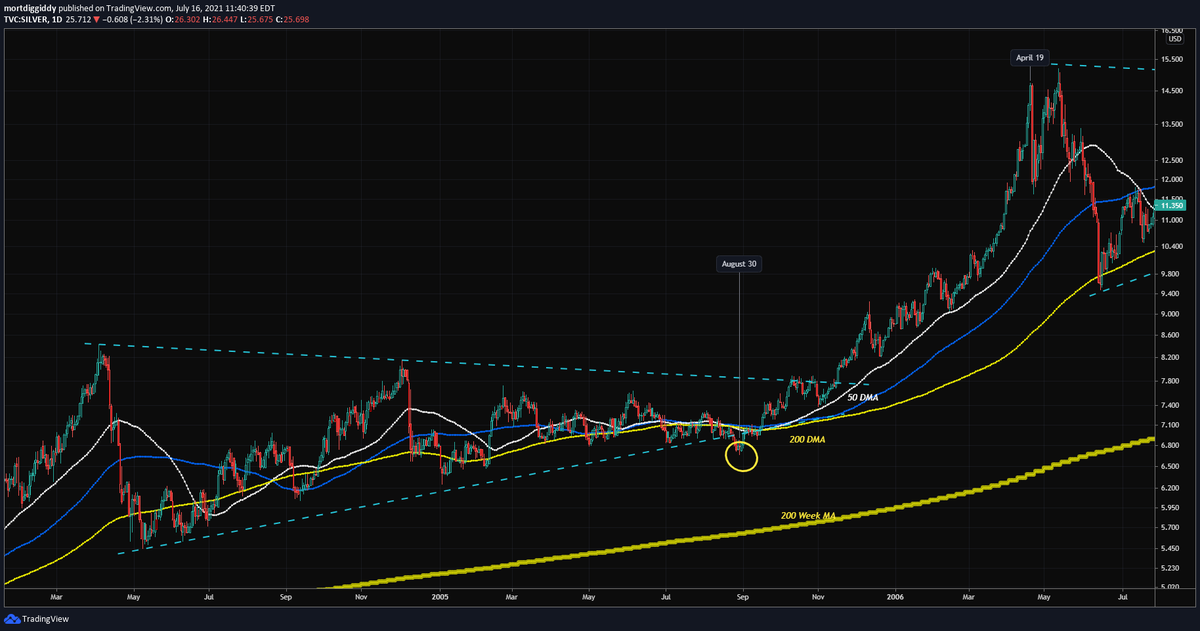
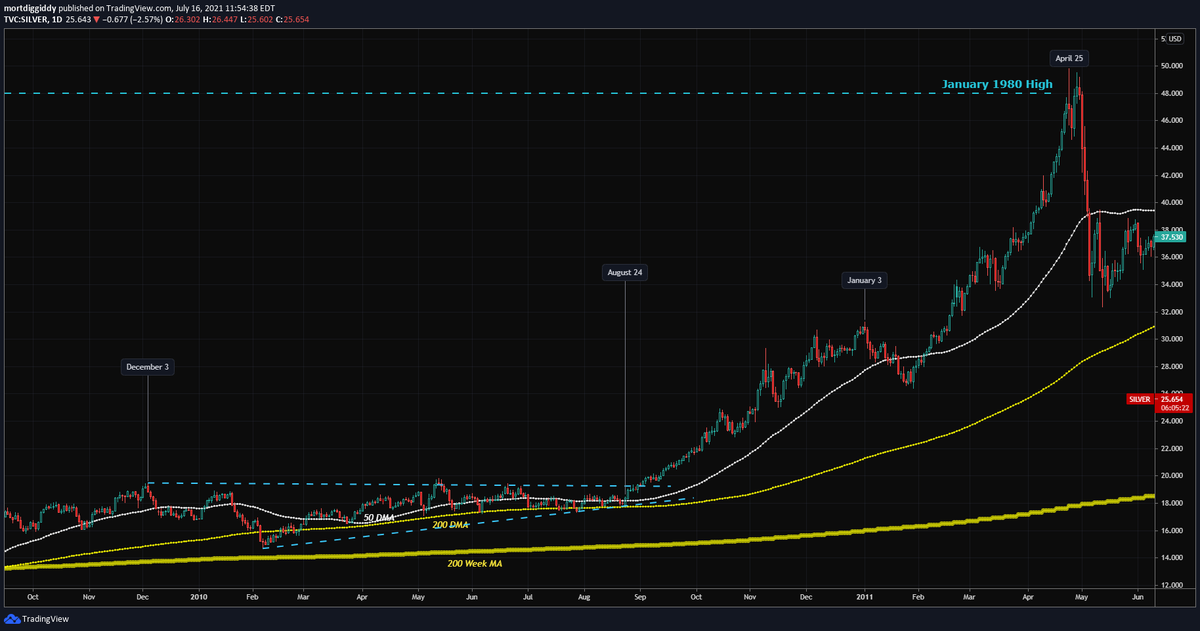
2004 kicked off a 1 year+ consolidation in silver, which did not start to rally until August of the following year.
There was a false break down in August that capitulated longs and trapped bears.
@graddhybpc
There was a false break down in August that capitulated longs and trapped bears.
@graddhybpc
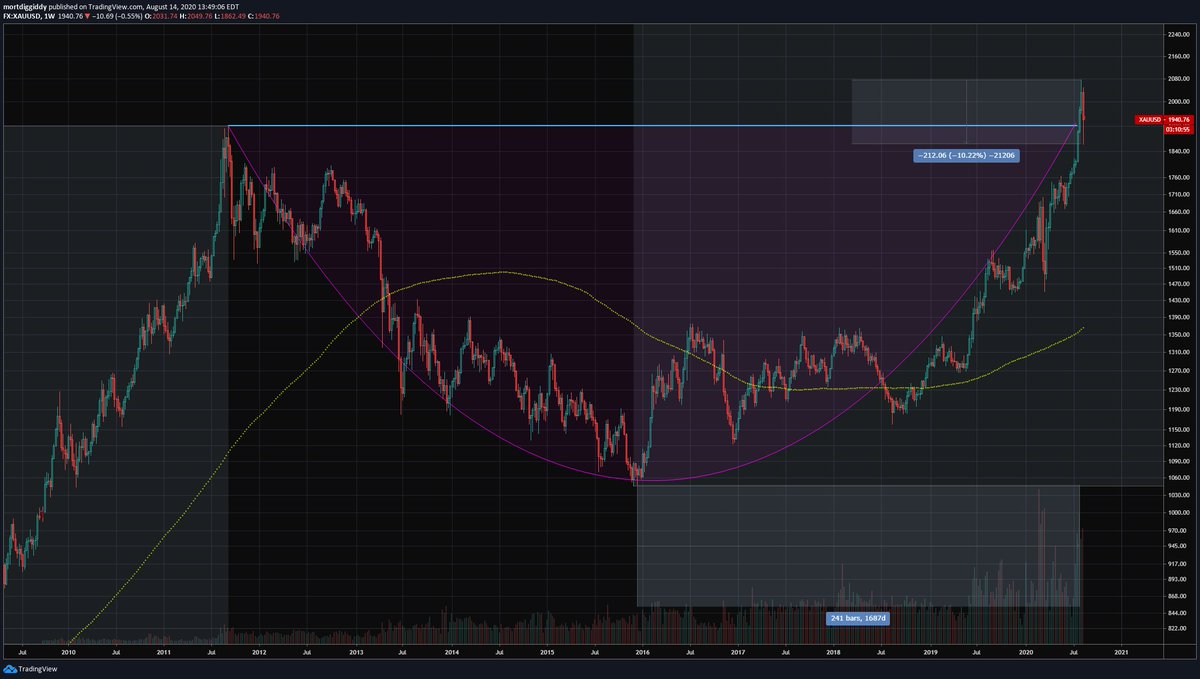
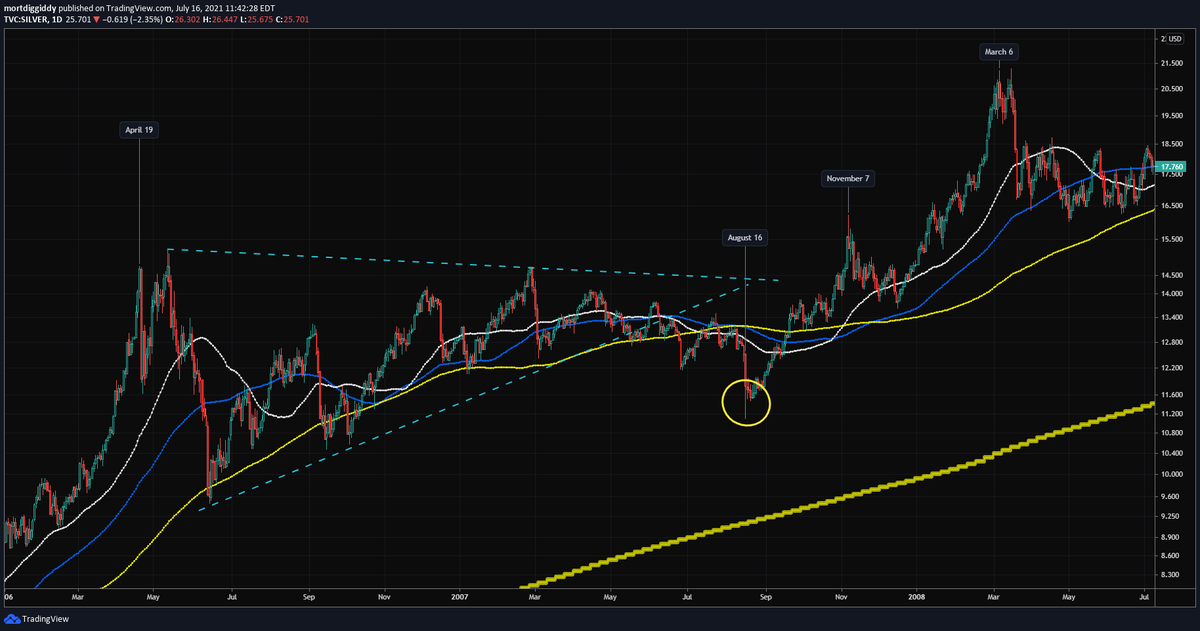
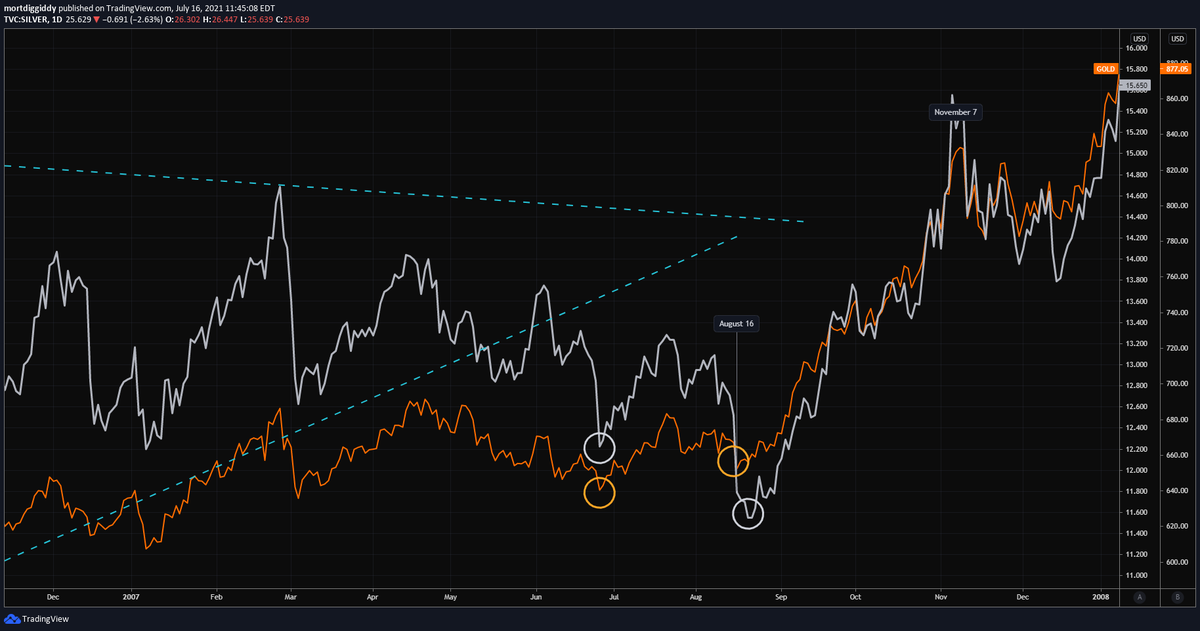
2006 saw another 1 year+ consolidation in silver. This time in August 2007 the following year the false breakdown was even more severe. On the second chart note that gold barely participated in that final selloff to August 16 2007.
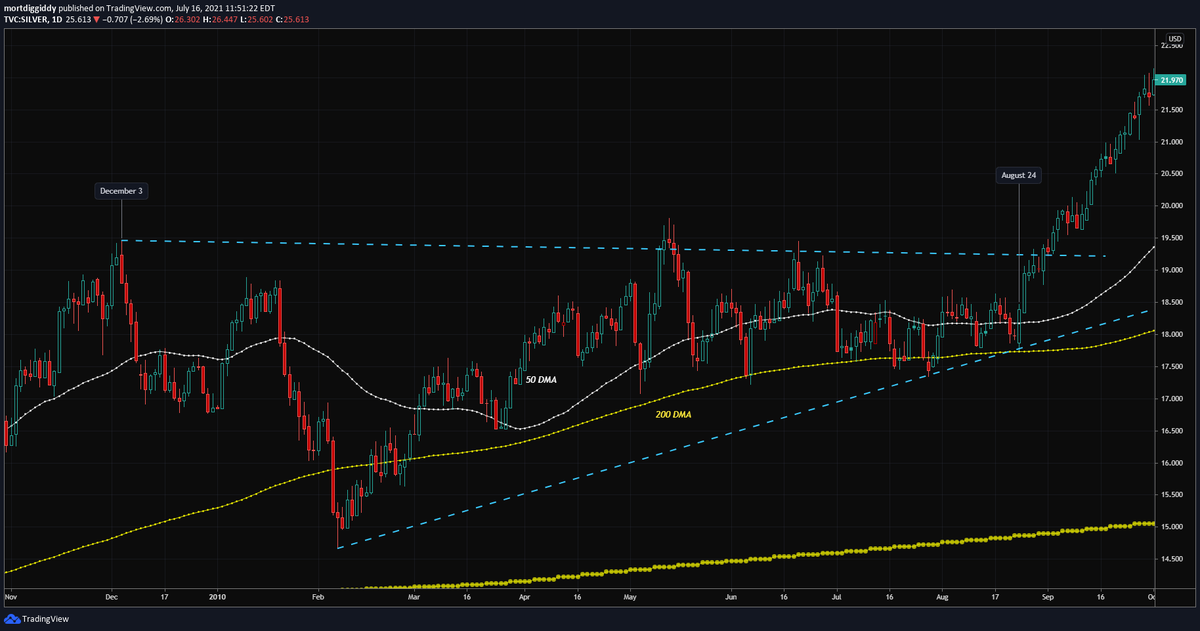
2010 had a shorter consolidation for silver, less than 1 year. The major rally that started the next year was still somewhere in August 2011.
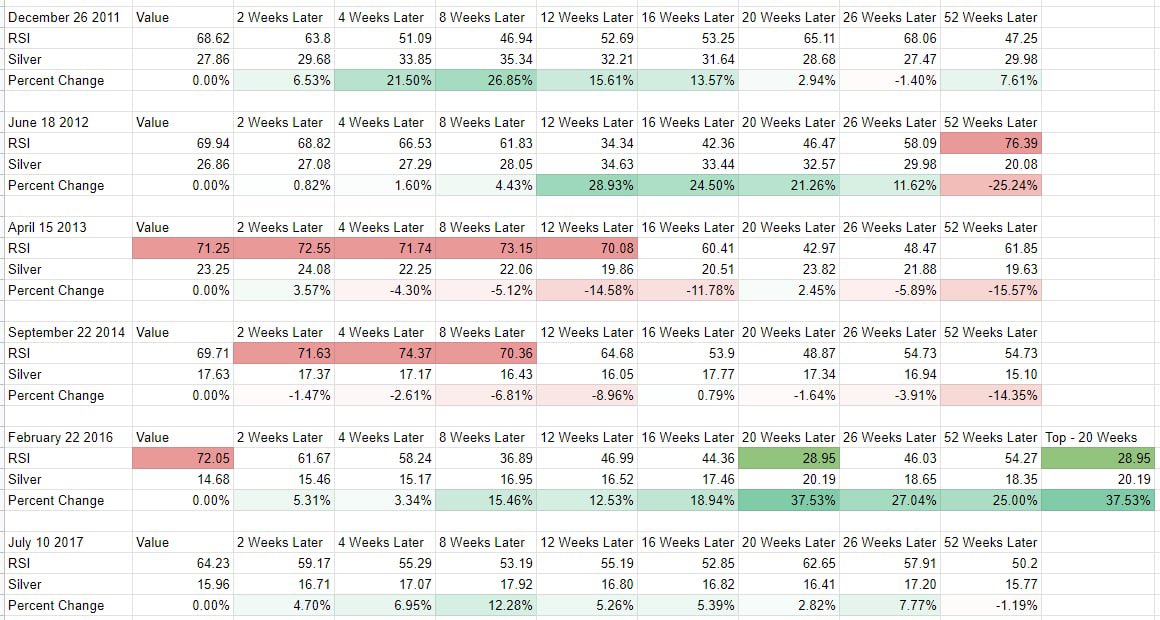
The major correction that started the next year at the seasonal MAR/APR top was due in part to the doubling of margin requirements by CME
The major correction that started the next year at the seasonal MAR/APR top was due in part to the doubling of margin requirements by CME
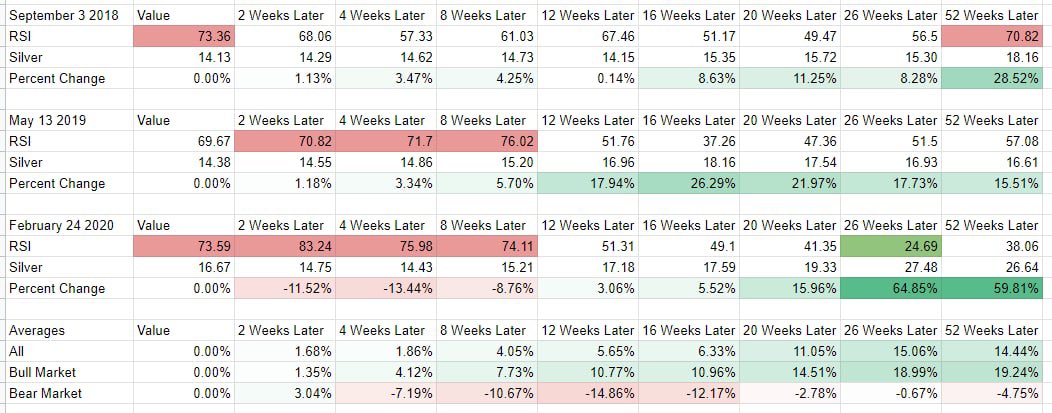
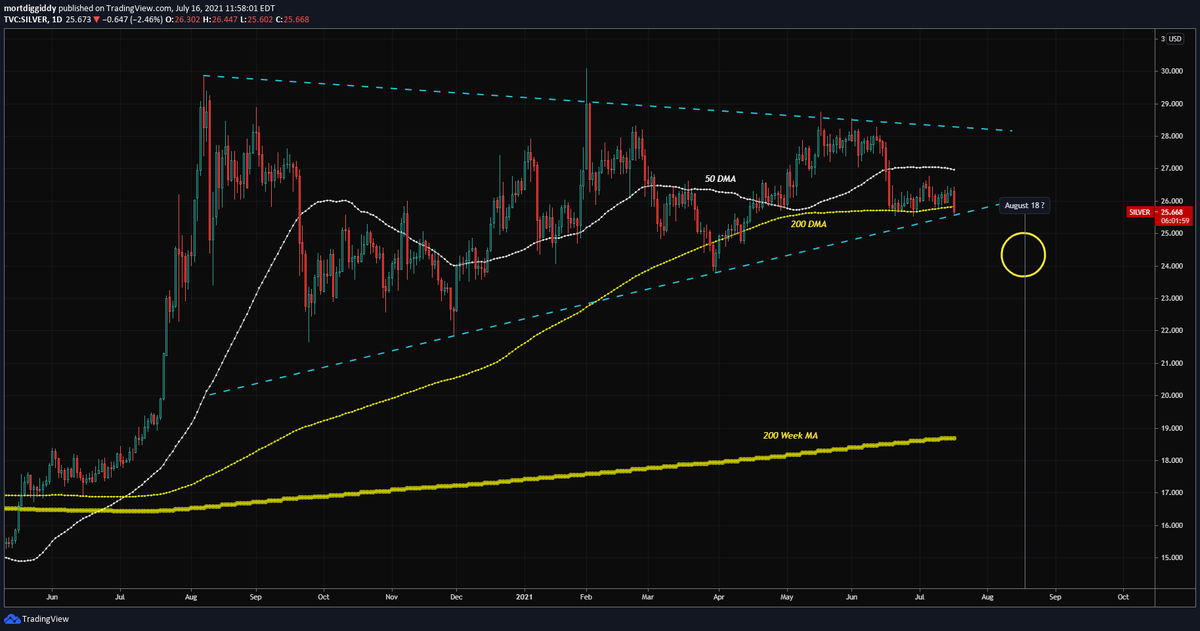
Currently 2021 looks like a blend of 2005 and 2010. Will we get a final capitulation low into August of this year before a major move up? Time will tell.
One thing to note, silver has never failed to make an ATH if gold has made one the prior year.
@InvResDynamics @TraderGab
One thing to note, silver has never failed to make an ATH if gold has made one the prior year.
@InvResDynamics @TraderGab
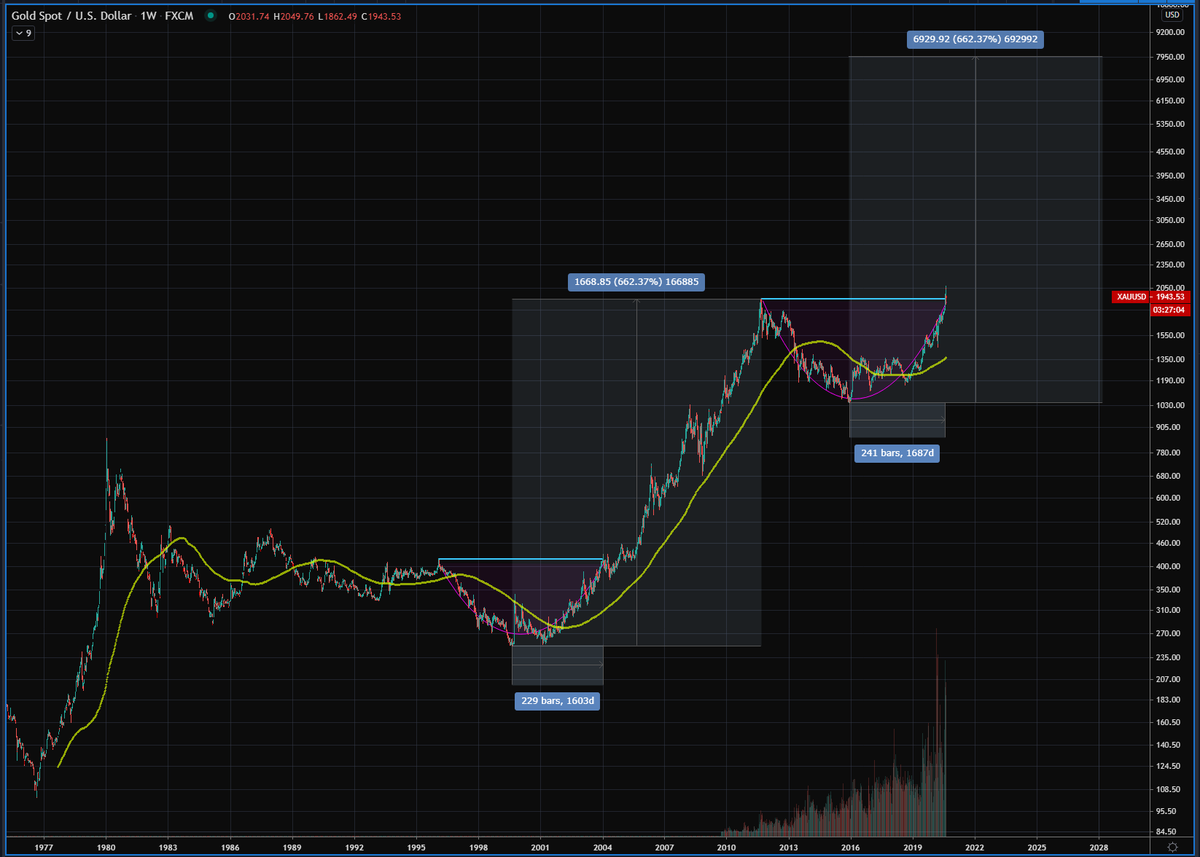
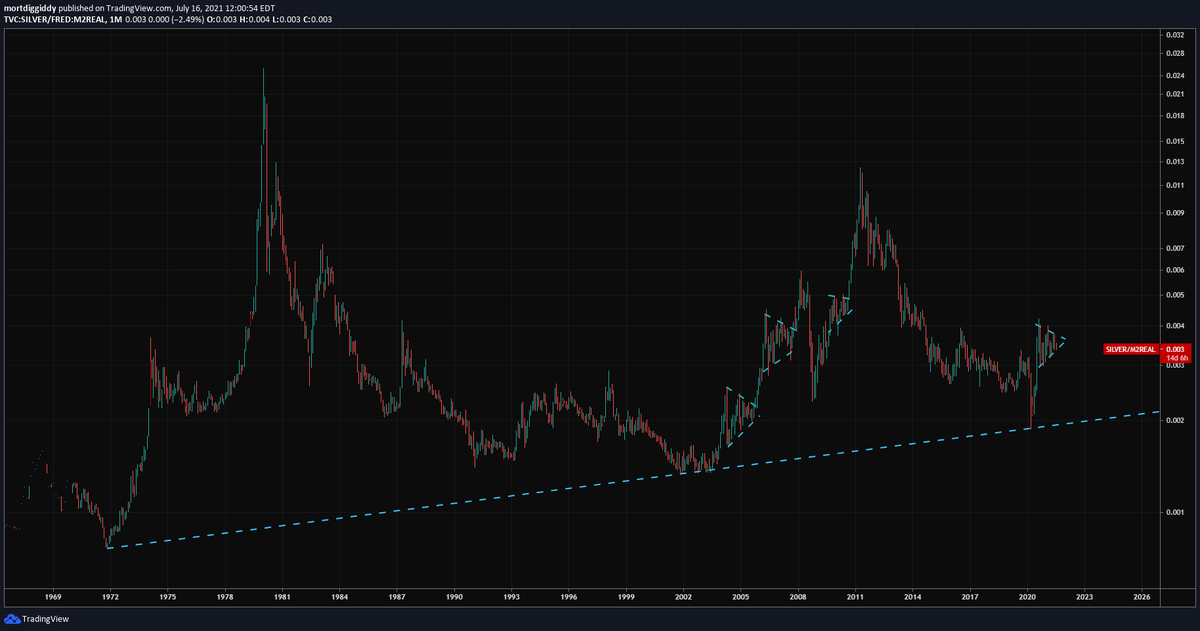
Last charts, silver/M2 (log, inflation adjusted with REAL M2) shows an interesting trendline. I have inserted the triangle structures for 2005, 2006, 2010, 2020.
Silver hit literal rock bottom in March 2020 in terms of real M2 broad supply, similar to 2003.
@badcharts1
/fin
Silver hit literal rock bottom in March 2020 in terms of real M2 broad supply, similar to 2003.
@badcharts1
/fin
Silver miners are a good buy between 12.85 - 13.00.
https://twitter.com/dailyedgegroup/status/1417208360559005710
• • •
Missing some Tweet in this thread? You can try to
force a refresh