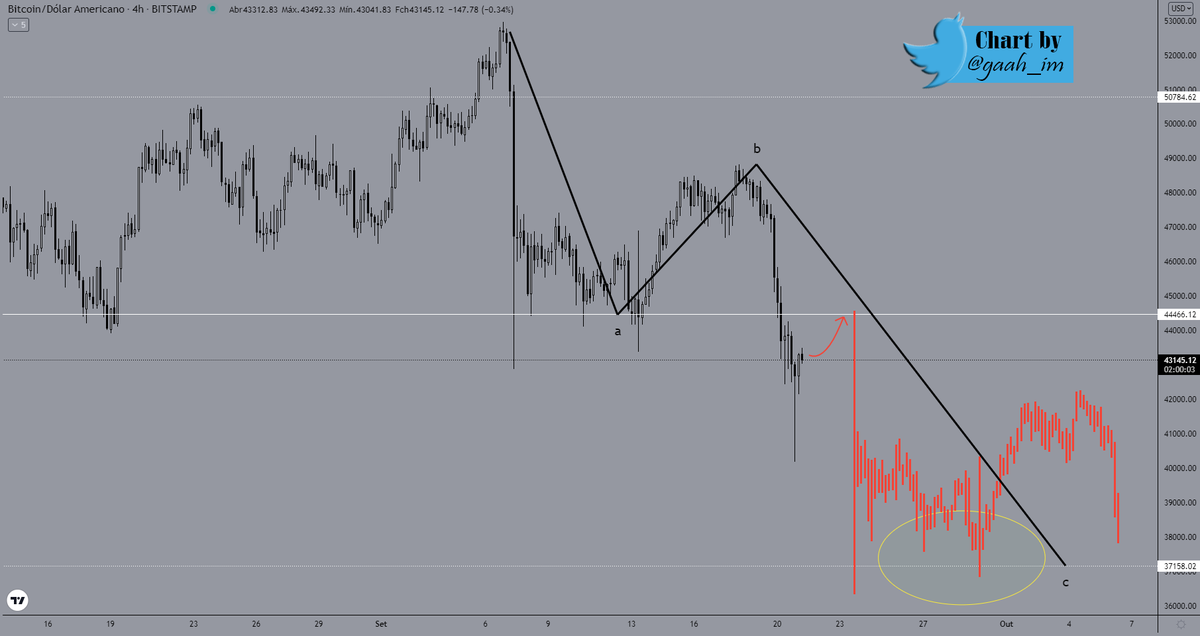
[Main support tested again, trap triggered and bears hurt] #Bitcoin
See also on Quicktake: cryptoquant.com/quicktake/60f9…
👇👇👇Follow the thread for more details:👇👇👇
See also on Quicktake: cryptoquant.com/quicktake/60f9…
👇👇👇Follow the thread for more details:👇👇👇
https://twitter.com/gaah_im/status/1417249215030435843
The test at the main support, $30,000 was successful and a new trap was made below this level, we have not lost the wick of the last bear trap, this is very positive.
The reversal pattern in Reserves was broken quickly, with only a single inflow impulse and an attempted ...
The reversal pattern in Reserves was broken quickly, with only a single inflow impulse and an attempted ...

continuation showing us that supply is at the limit.
The higher probability is that reserves are now starting to move lower, drying up supply in the long term pattern that we have been following since 2020 as shown by the red arrow.
The higher probability is that reserves are now starting to move lower, drying up supply in the long term pattern that we have been following since 2020 as shown by the red arrow.

Continuing in the movement of Bitcoin reserves falling, the price should break through the crate that is between $30,000 to $41,000.
Why have the reserves along with the price been drifting in the opposite direction of the primary trend since the fall?
Why have the reserves along with the price been drifting in the opposite direction of the primary trend since the fall?
There is selling at that level, but there are also buyers drying up the available supply, until it runs out the price will continue within the accumulation.
So it is crucial to follow the stocks and identify the pattern in the short term to gauge the probability of continued ...
So it is crucial to follow the stocks and identify the pattern in the short term to gauge the probability of continued ...
supply or diminishing supply within the stock market.
Between the 20th and 21st there was outflow of over 6,000 BTC by miners, Netflow turned negative after prices lost major support, indicating that there are miners who have already expected a retest at major support.
Between the 20th and 21st there was outflow of over 6,000 BTC by miners, Netflow turned negative after prices lost major support, indicating that there are miners who have already expected a retest at major support.

This could be a good confirmation of increased probability of $30,000 being the minimum bottom for this short-term downtrend. 

Stablecoin stocks had already moved up as the price was making new bottoms toward major support. Reserves remain near the top and watching inflows is the best thing to do for the short term as a rise means potentially prices seek the top of the accumulation. 

Between the 20th and 21st also Netflow turned positive for Stablecoin, we don't have significant volume but there is inflow coming in and from what I can read there were players expecting new test or possibly new traps and those same players apparently filled their bellies. 

The opportunity to buy into new traps was alerted recently in other Quicktake looking at some of these same metrics made available.
https://twitter.com/gaah_im/status/1417249218398408704?s=20
We should wait for confirmation, and it will indeed come when the price breaks through the ~$37,000 range. Above this we can say that the bulls are in control in the short term and may once again lead to a continuation of the primary trend which is in favor of their army. 

The best business will always be to buy in tranches, as the price goes lower there is then opportunity to increase the hand, never buy 100% net capital at one price level! 

In the last post I showed the comparison with the past cycle and that we are not in a bear market, and the current cycle is similar to 2013.
Follow that in the next few days I will post an MVRV update precisely showing the 2013 cycle and we can clearly see that we are still in a bull market.
Follow the charts live on CQ: cryptoquant.com/prochart/lFjbR…
cryptoquant.com/prochart/OCxOS…
cryptoquant.com/prochart/zpkfC…
Follow the charts live on CQ: cryptoquant.com/prochart/lFjbR…
cryptoquant.com/prochart/OCxOS…
cryptoquant.com/prochart/zpkfC…
• • •
Missing some Tweet in this thread? You can try to
force a refresh


