G a a h Profile picture
Trader #BTC #ETH 📊 | Copy Trading available @BingXOfficial @okx @Bybit_Official | Verified Author @cryptoquant_com✍🏻 ⚡️gaah@zbd.gg⚡️
Paul Profile picture Howard Cohen Profile picture 2 subscribed
May 19, 2022 5 tweets 3 min read
#Bitcoin 's "post Halving cycle" is compromised.

After each new Halving the price has developed cyclically different behavior.
The structures are similar, but not the same.

-Follow the thread below👇 1/5🧵 In 2013 the price advanced 2 full channels (3 phases), leaving the first move without phase4.

In 2017 price advanced only 1 full channel (3 phases) besides phase 4 being the fastest in history, until then.

#BTC #Bitcoin

2/5🧵
Mar 18, 2022 4 tweets 2 min read
The price has tried the last 3 times to break $40.8k and was successful, next testing $44.4k.

However it came back all 3 times equally, ripping down in search of $37k.

This time price is fighting with high volatility at $40.8k

#Bitcoin

1/4🧵 $40.8k is the key to probability being in favor of a trend reversal (breaking $44.4k), currently the risk of breaking $37k still exists if $40.8k continues to be Resistance!

2/4🧵

Mar 17, 2022 5 tweets 3 min read
During an uptrend people rush to buy and sell with a sense of desperation, not wanting to be left out of valuations.

Such holders move the Network at these times, creating UTXO/spending UTXO at a profit.

#Bitcoin

1/5🧵 After a spent output is realized, the price in USD of the UTXO created/UTXO spent shows whether the UTXO realized profit/loss.

With one more variable (lifespan) included, in the realization it categorizes whether it is STH(age 1h~155days) or LTH(age >155days).

2/5🧵
Sep 23, 2021 16 tweets 7 min read
The best time to buy #Bitcoin is now!

The ratio MVRV is defined as the market capitalization of an asset divided by the realized capitalization. With this indicator it is possible to map the behavior in previous cycles and define the revenue of the current moment.

Thread👇👇 1. Ranking the phases of the cycles in sequence of 1-3 starting with NUMBER 1 after the start of the bull market and the top meeting in the middle of the bullish cycle.
Sep 22, 2021 8 tweets 3 min read
3.5 channel breaks in 2013, reversal requires 4 total channel breaks, totaling 1 entire sub-cycle. 2.5 channel breaks in the correction we are currently in, much softer than 2013 even retracing -55% since the last top.
Sep 21, 2021 4 tweets 2 min read
The yellow dotted arrow shows the complete move, it advances 0.5 of the channel in a complete move.

The breakout attempt above 50% led to the trap, and is discounted later in the PIVOT to miss the main bottom of the last few pattern moves. Image Breaking through sets up a new full move and hits $37k, at the stealth point of the price rebound.

It has only walked 0.5 of the move (the discount at 50% and at the PIVOT). This moment is crucial for the Bulls to advance above $44,400 and have a daily close. Image
Sep 21, 2021 9 tweets 3 min read
About Management and Risk, follow the Thread👇

1. Due to the Macro environment in the chain and the cyclical moment that #Bitcoin is in, I am leaving the more aggressive Risk Management in the Private Fund (BANCA2) that I manage. 2. Today we have positions in over 10 different crypto-actives, including the largest position in #Bitcoin .

The targets set are according to the expansions of my operating model, so they will only be hit when the market wants them.
Sep 20, 2021 6 tweets 3 min read
1. The number of transactions occurring on the #Bitcoin network still below the yellow average, signals little movement on the chain. If this number stays above the yellow average indicates new dormant participants moving in, volatility in the price is expected. Image 
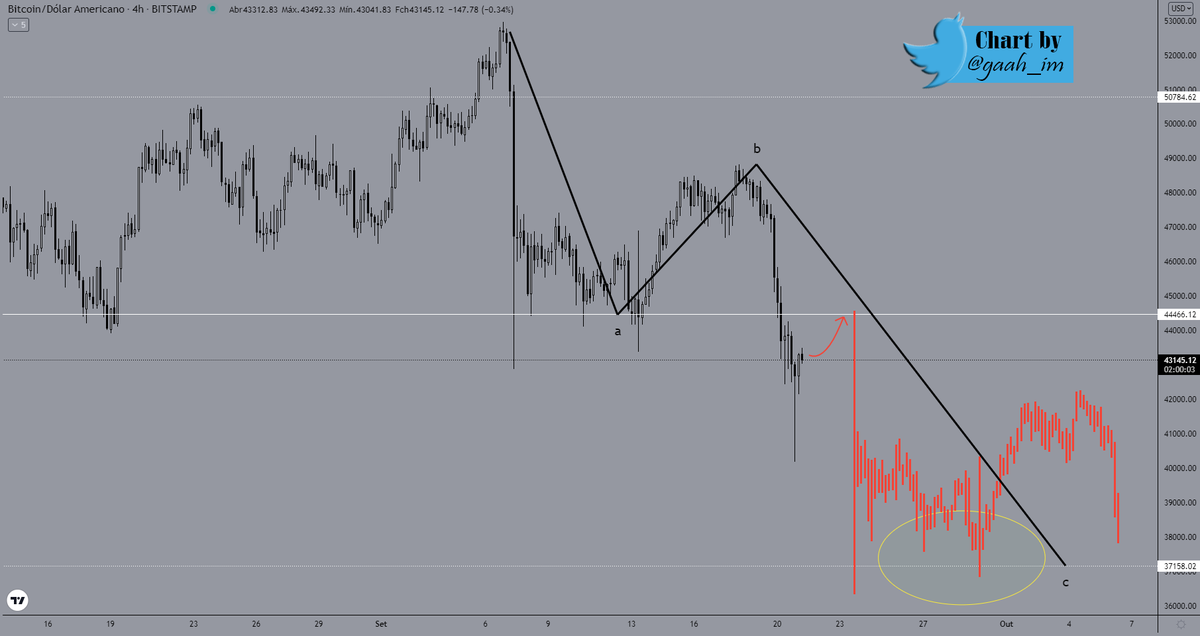
2. Already the average number of tokens transferred on the network points to another new top, followed by 3 tops in sequence since trapping at major support. The latest record points to an average of 42.15 #BTC transferred per transaction. Image
Sep 8, 2021 5 tweets 2 min read
1/5 Miners back accumulate from the correction to the support at $30,000, there were miners selling during the correction, but only to supplement cash as there was the ban in China and then they had to relocate to a different location.

Thread👇👇 I recently posted the pattern identified in the MPI, which shows when miners sell.

2/5 The Reserves show the time when they offered to sell, around $25,000 to $30,000 right at the beginning of the year.👇

Sep 7, 2021 6 tweets 3 min read
HODLERS stronger than ever! #Bitcoin

1/5 SCA in record after record, HODLERS never stopped buying, they are accumulating more than ever.

Long-term holders aged 2-3 years and 12-18 months continue to accumulate strongly, as reflected in the SCA.

Follow the Thread👇👇 2/5 This indicator is the value of the sum of unspent coins, transaction output in live days, and their value.

Since testing support at $30,000 these guys have flipped their hand to buy.
Sep 6, 2021 10 tweets 4 min read
Time seems to tell about a new historical top! #Bitcoin

-Price starting from Halving:

Is it possible for this cycle to be the longest lasting?
It still has time if it repeats like 2016, as the previous cycle was longer compared to 2012.

Follow the Thread [6]👇👇 Image -Price from the breaking of the last ATH:

It is earlier than all cycles. The historical suggestion is that there is still enough time to make new corrections as well as new ATHs. Image
Aug 31, 2021 6 tweets 3 min read
[The bull market is not over, phase 1 has just begun!]

1/7 Historically #Bitcoin cycles follow a pattern divided into 4 sequence. The starting point is the first mid-cycle top post Halving onward, this is an update of the recent charting I did.

Thread 👇👇 2/7 The yellow box is touched when prices make a mid-cycle top, historically the end-of-cycle top is only realized with Puell Multiple hitting the red box, this has been the case in all previous cycles.
Aug 3, 2021 30 tweets 11 min read
$65,000 is not top end of #Bitcoin cycle, bull market is not over!

I recently did an article using MVRV to map the cycles and behavior during bear and bull market period

In this text you will see a new cycle mapping, but using another data, this time the Puell Mutiple

Thread👇 
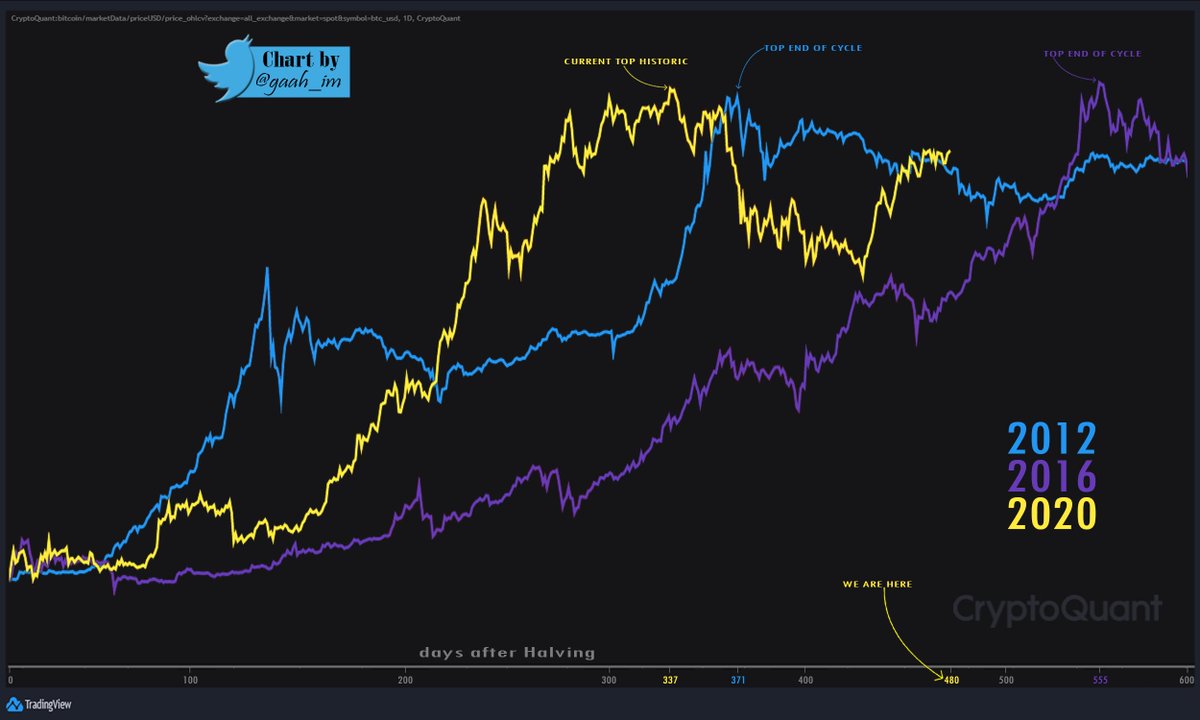
1. The mapped sequence tells the timing during Bitcoin's bull and bear market. The cycles are standardized and the movements are similar.

In all cycles there were tops in the middle of the bull market in which led the Puell Multiple towards the green box (bottom|buy region) 👇
Jul 24, 2021 5 tweets 2 min read
[Short sales are becoming more aggressive] #Bitcoin

Short sell-offs begin to be more aggressive since the first trap below major support at $30,000

Since COVID DAY when we had sell-offs at the same level, that volume has been going up as price has also followed.

Thread👇👇 We are now at this same level and descending from the historical top, ready to start going up in volume slaughtering the bears?

Also read by Quicktake: cryptoquant.com/quicktake/60fb…
Jul 23, 2021 29 tweets 10 min read
[We are still in the bull market] #Bitcoin

You can also see it from Quicktake: cryptoquant.com/quicktake/60fa…

👇👇To view all the details of the data presented follow the thread👇👇 1. I recently posted a Quicktake saying that we are not in a bear market and did the comparison of the current cycle with the previous cycle, 2017 using the MVRV. Now, we have the full chart from the first moves to the first Halving and the 2013 cycle which is quite similar to...
Jul 22, 2021 14 tweets 5 min read
[Main support tested again, trap triggered and bears hurt] #Bitcoin

See also on Quicktake: cryptoquant.com/quicktake/60f9…

👇👇👇Follow the thread for more details:👇👇👇 The test at the main support, $30,000 was successful and a new trap was made below this level, we have not lost the wick of the last bear trap, this is very positive.

The reversal pattern in Reserves was broken quickly, with only a single inflow impulse and an attempted ... Image