I like to compare companies with different metrics. It helps me understand a little better each business. This time, I am sharing the metric Gross Profit / Employee.
Hope you find it interesting 🙂
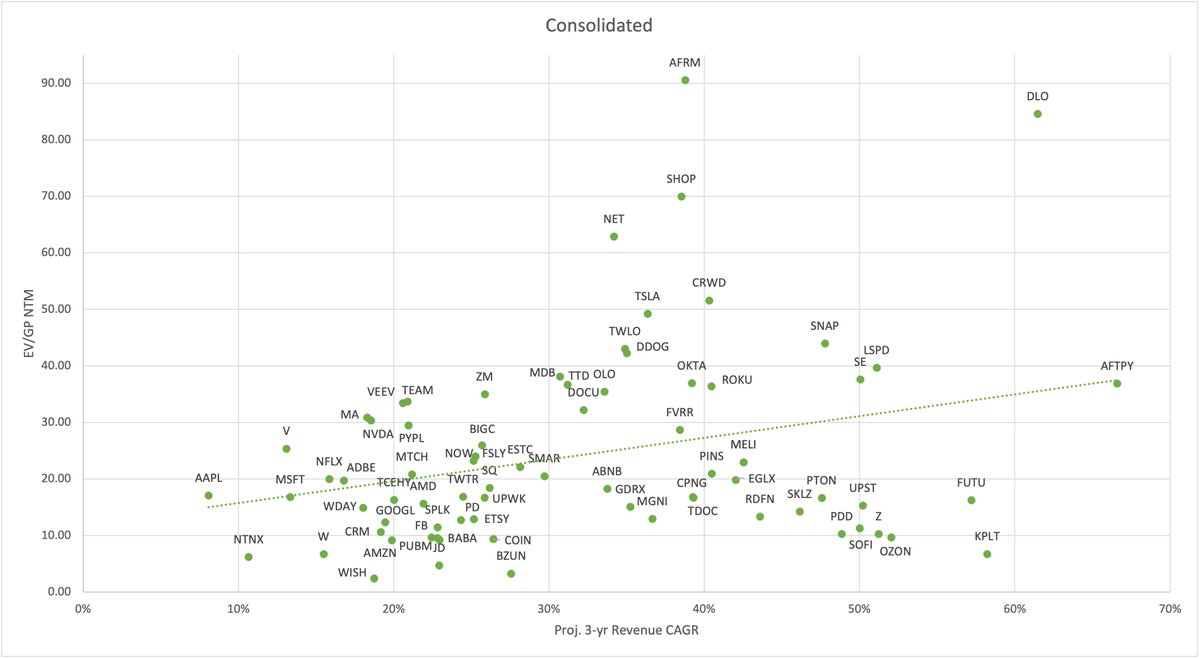
This is the consolidated graph. The next graphs are grouped by industry 👇
Hope you find it interesting 🙂
This is the consolidated graph. The next graphs are grouped by industry 👇

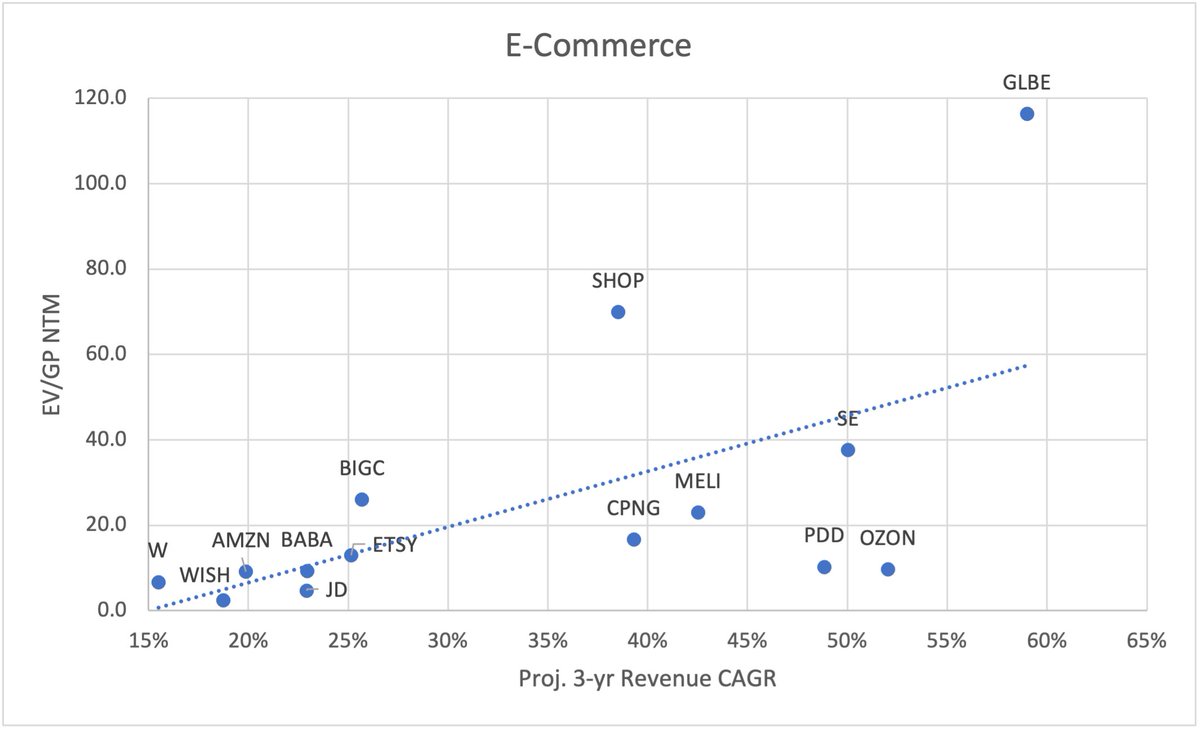
1.E-Commerce
Gross Profit / Employee (FY 2020)
$ETSY $909k
$PDD $712K
$W $248k
$SHOP $234k
$BABA $179k
$GLBE $154K
$CPNG $148k
$BIGC $132k
$MELI $125k
$AMZN $120k
$OZON $100K
$JD $55K
$SE $54K
Gross Profit / Employee (FY 2020)
$ETSY $909k
$PDD $712K
$W $248k
$SHOP $234k
$BABA $179k
$GLBE $154K
$CPNG $148k
$BIGC $132k
$MELI $125k
$AMZN $120k
$OZON $100K
$JD $55K
$SE $54K

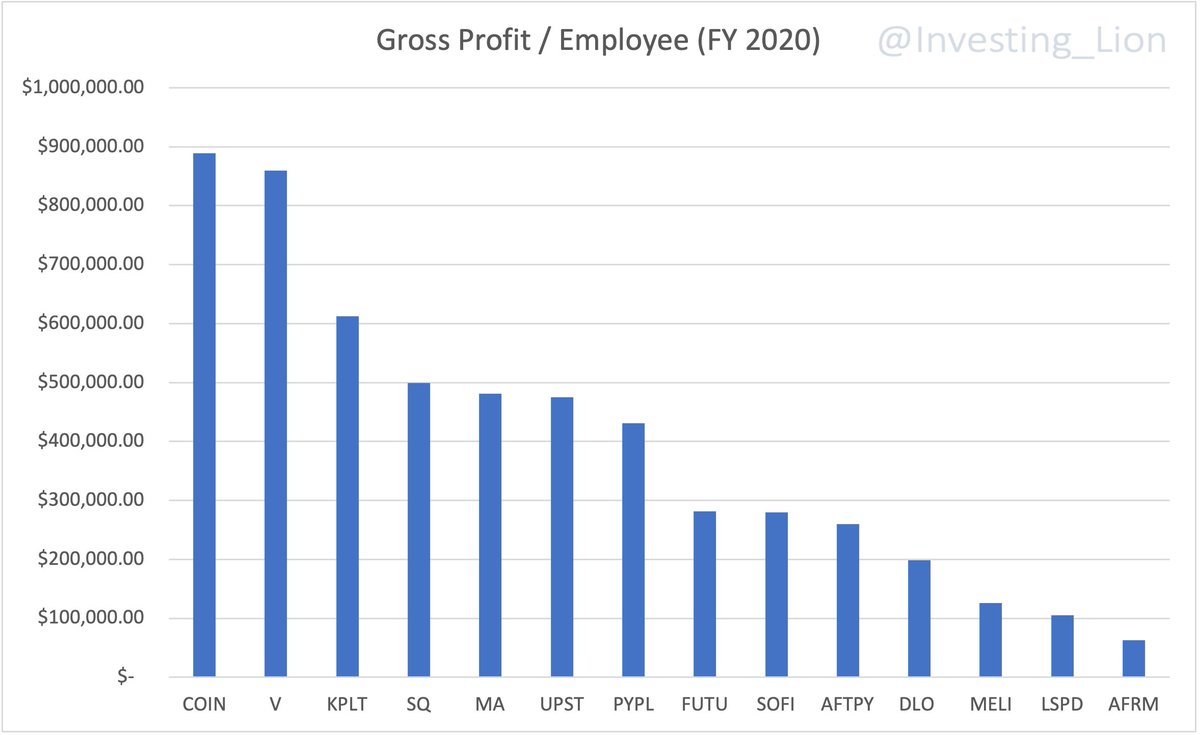
Fintech and Payments
Gross Profit / Employee (FY 2020)
$COIN $888K
$V $859K
$KPLT $612K
$SQ $499K
$MA $481k
$UPST $475k
$PYPL $431k
$FUTU $282k
$SOFI $279k
$AFTPY $260k
$DLO $198k
$MELI $126k
$LSPD $105k
$AFRM $63k
Gross Profit / Employee (FY 2020)
$COIN $888K
$V $859K
$KPLT $612K
$SQ $499K
$MA $481k
$UPST $475k
$PYPL $431k
$FUTU $282k
$SOFI $279k
$AFTPY $260k
$DLO $198k
$MELI $126k
$LSPD $105k
$AFRM $63k
Social Media and Digital Ads
Gross Profit / Employee (FY 2020)
$FB $1,181k
$MTCH $934k
$GOOGL $733k
$PINS $496k
$TTD $427k
$TWTR $425k
$SNAP $339k
$ROKU $299k
$MGNI $256k
$PUBM $203k
Gross Profit / Employee (FY 2020)
$FB $1,181k
$MTCH $934k
$GOOGL $733k
$PINS $496k
$TTD $427k
$TWTR $425k
$SNAP $339k
$ROKU $299k
$MGNI $256k
$PUBM $203k

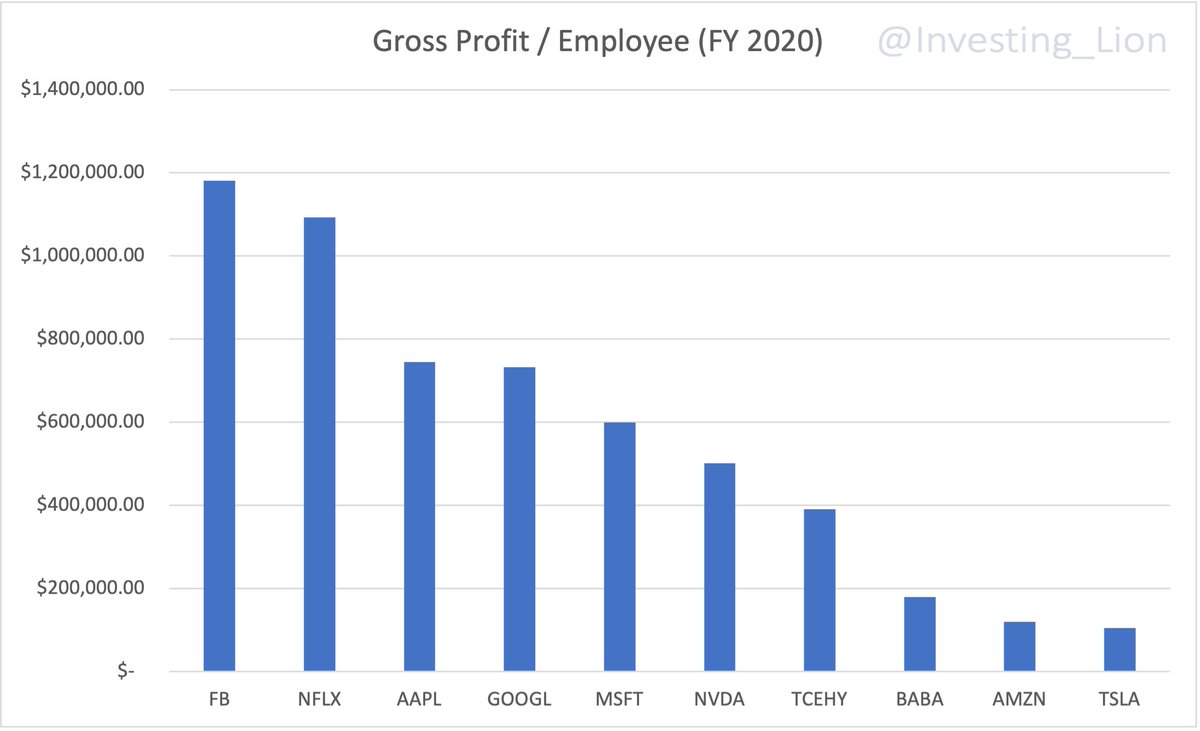
Mega Cap
Gross Profit / Employee (FY 2020)
$FB $1,181k
$NFLX $1,092k
$AAPL $745k
$GOOGL $733k
$MSFT $600k
$NVDA $501k
$TCEHY $391k
$BABA $180k
$AMZN $120k
$TSLA $105k
Gross Profit / Employee (FY 2020)
$FB $1,181k
$NFLX $1,092k
$AAPL $745k
$GOOGL $733k
$MSFT $600k
$NVDA $501k
$TCEHY $391k
$BABA $180k
$AMZN $120k
$TSLA $105k
SAAS
Gross Profit / Employee (FY 2020)
$ZM $733k
$OLO $603k
$ADBE 502k
$CRM $322k
$SPLK $286k
$TEAM $277k
$PD $271k
$NOW $271k
$ESTC $232k
$DDOG $214k
$TWLO $195k
$NET $184k
$FSLY $169k
$SNOW $169k
$NTNX $167k
$OKTA $154k
$CRWD $154k
$DOCU $132k
$MDB $116k
Gross Profit / Employee (FY 2020)
$ZM $733k
$OLO $603k
$ADBE 502k
$CRM $322k
$SPLK $286k
$TEAM $277k
$PD $271k
$NOW $271k
$ESTC $232k
$DDOG $214k
$TWLO $195k
$NET $184k
$FSLY $169k
$SNOW $169k
$NTNX $167k
$OKTA $154k
$CRWD $154k
$DOCU $132k
$MDB $116k

Real Estate / Healthcare / Gig Economy / Gaming / Other
Gross Profit / Employee (FY 2020)
$GDRX 1,084k
$SKLZ $788k
$UPWK 501K
$ABNB $453k
$AMD $347k
$FVRR $289k
$Z $237k
$PTON $224k
$TDOC $164k
$EGLX $135k
$BZUN $82k
$RDFN 51k
$LTCH 18k
Gross Profit / Employee (FY 2020)
$GDRX 1,084k
$SKLZ $788k
$UPWK 501K
$ABNB $453k
$AMD $347k
$FVRR $289k
$Z $237k
$PTON $224k
$TDOC $164k
$EGLX $135k
$BZUN $82k
$RDFN 51k
$LTCH 18k

This is an interesting comparison metric (one of many) that can be analyzed to compare productivity between companies and industries at a point in time.
The trend of this ratio is probably more important than the current ratio. I may do a thread in the future based on trends.
The trend of this ratio is probably more important than the current ratio. I may do a thread in the future based on trends.
If you are more interested in valuation, I did a thread comparing these companies based on EV/GP NTM vs 3-year CAGR last week.
You can see that other thread here 👇
You can see that other thread here 👇
https://twitter.com/Investing_Lion/status/1415653929745059843?s=19
If you are still reading this, thank you! 🙏
Is there another metric that may interest you for future posts?
CC:
@skaushi @Soumyazen @caleb_investTML @PelotonHolder @qcapital2020 @StockMarketNerd @Prof_Kalkyl @IrnestKaplan
Is there another metric that may interest you for future posts?
CC:
@skaushi @Soumyazen @caleb_investTML @PelotonHolder @qcapital2020 @StockMarketNerd @Prof_Kalkyl @IrnestKaplan
• • •
Missing some Tweet in this thread? You can try to
force a refresh