1/17 Cycling On-Chain #3: Squeezed Supply, Shorts and Bitcoin Lemonade 🍋
Read all about #bitcoin lemonade that is based on squeezing supply, shorts & weak hands in this summary 🧵
...or in more detail in the original article on @BitcoinMagazine itself: bitcoinmagazine.com/markets/bitcoi…
Read all about #bitcoin lemonade that is based on squeezing supply, shorts & weak hands in this summary 🧵
...or in more detail in the original article on @BitcoinMagazine itself: bitcoinmagazine.com/markets/bitcoi…

2/17 Last year, @Glassnode learned that when an Unspent Transaction Output (UTXO) is >155 days old, its has a relatively low probability of being spent
Based on this, they created Short-Term Holder (STH) and Long-Term Holder (LTH) supply metrics
Based on this, they created Short-Term Holder (STH) and Long-Term Holder (LTH) supply metrics

3/17 If you divide @glassnode's LTH supply by the circulating #bitcoin supply, you get a LTH Supply Ratio that quantifies the portion of the supply that is estimated to belong to LTHs
LTHs tend to sell against market strength (🟥) and accumulate during market weakness (🟩)
LTHs tend to sell against market strength (🟥) and accumulate during market weakness (🟩)

4/17 The LTH Supply Ratio also allows us to more accurately compare recent and historical relative LTH supply ownership
During the recent $65k top the LTH Supply Ratio decreased, but hasn't reached the lows of the prior market cycle tops (yet)
During the recent $65k top the LTH Supply Ratio decreased, but hasn't reached the lows of the prior market cycle tops (yet)

5/17 @glassnode also applied algorithmic clustering of addresses, recognizing entities that were labelled illiquid (🟩) or liquid (🟥) based on spending history
PS: Check out @BitcoinQ_A's privacy guide to learn how to improve your own #bitcoin privacy: bitcoiner.guide/privacy/
PS: Check out @BitcoinQ_A's privacy guide to learn how to improve your own #bitcoin privacy: bitcoiner.guide/privacy/

6/17 To get a better look at changes in the illiquid supply, @glassnode also created a (30-day) net illiquid supply change metric
This metric clearly shows how previously illiquid coins suddenly became liquid during the early May FUD, whereas the market is now accumulating again
This metric clearly shows how previously illiquid coins suddenly became liquid during the early May FUD, whereas the market is now accumulating again

7/17 Since supply increases with each block, we need to adjust for circulating supply to allow historical comparison
We then see that:
1) Recent illiquid supply decreases were reached 3x during the previous cycle
2) Current values were last seen mid-2017, before the blow-off top
We then see that:
1) Recent illiquid supply decreases were reached 3x during the previous cycle
2) Current values were last seen mid-2017, before the blow-off top

8/17 Similar to the Liquid Supply Ratio that @WClementeIII & @woonomic recently introduced, you can also visualize the (il)liquid supply as a percentage of the circulating supply (h/t @typerbole), which shows us how much of the #bitcoin supply is (il)liquid

9/17 If we look at the illiquid supply percentage, we see that after flooding the market with liquid coins after #bitcoin got a market price, the illiquid supply percentage's contraction rate decreased after each halving

10/17 If we then zoom in on the last year, we see that since the start of July, the illiquid supply increased relatively drastically and is now at levels not seen since #bitcoin was trading around $55k, which has not been fully reflected into price yet

11/17 Since the May 19th capitulation event, sentiment went bearish and the futures markets went increasingly short
After bouncing off the recent ~$30k lows, a supply squeeze occurred, as the liquidation of (naked) shorts lead to a cascading price increase by >$10k within a week
After bouncing off the recent ~$30k lows, a supply squeeze occurred, as the liquidation of (naked) shorts lead to a cascading price increase by >$10k within a week

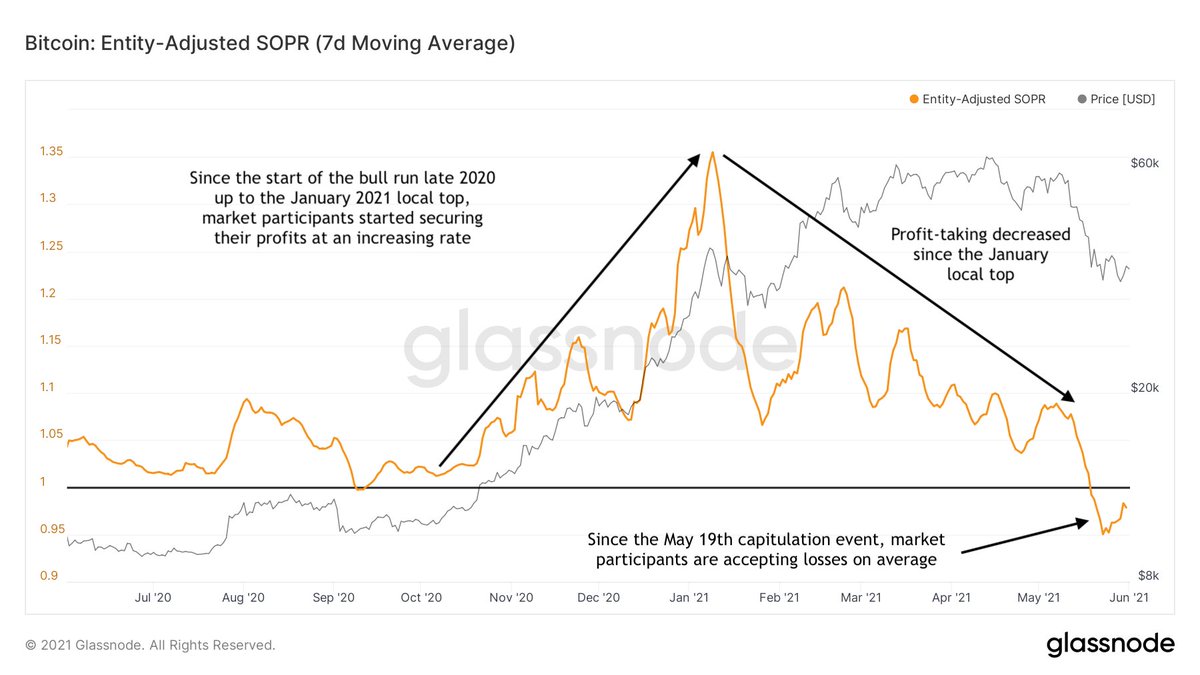
12/17 Upon this price increase, coins that moved on-chain remained relatively young but increasingly moved at a profit
This may mean that inexperienced market participants jumped on the opportunity to sell at or above break-even & thus squeezing out more relatively weak hands
This may mean that inexperienced market participants jumped on the opportunity to sell at or above break-even & thus squeezing out more relatively weak hands

13/17 Entities holding 1-100 #bitcoin were selling all the way up to capitulation - but have resumed accumulation since
Entities holding up to 1 #bitcoin are on average always stacking 💪
Entities holding 100-1k #bitcoin bought close to the top & just sat on their positions
Entities holding up to 1 #bitcoin are on average always stacking 💪
Entities holding 100-1k #bitcoin bought close to the top & just sat on their positions

14/17 During this last bounce off the ~$30k lows, almost 112k #bitcoin have been withdrawn from exchanges, adding fuel to the fire that a new supply squeeze might be ongoing

15/17 Since this recent price turnaround, #bitcoin market sentiment appears to have turned quite a bit
On a Twitter poll that ended on July 31st, respondents were predominantly bullish on all timeframes 🐂
On a Twitter poll that ended on July 31st, respondents were predominantly bullish on all timeframes 🐂

16/17 Those poll results align with the Fear & Greed Index (FGI), that scrapes multiple social media platforms and algorithmically assesses the market sentiment on #Bitcoin related posts
FGI was full of fear & anxiety throughout the price dip, but has now flipped to greed again
FGI was full of fear & anxiety throughout the price dip, but has now flipped to greed again

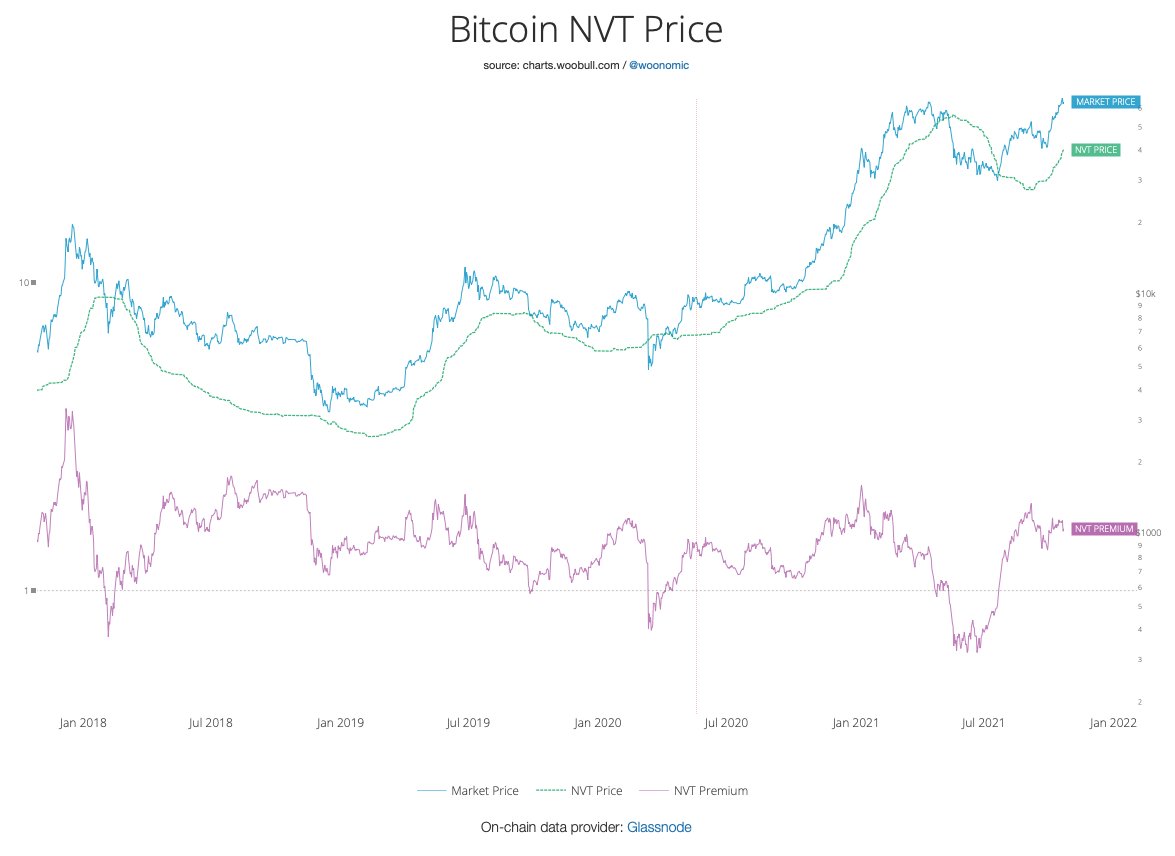
17/17 On-chain metrics themselves are not predictive, but some models try to
Each have their own limitations, but together they form an overview of where price may go if history repeats or rhymes
Will this cycle break some models, or will another supply squeeze drive up price?
Each have their own limitations, but together they form an overview of where price may go if history repeats or rhymes
Will this cycle break some models, or will another supply squeeze drive up price?

• • •
Missing some Tweet in this thread? You can try to
force a refresh