How we live in England and Wales changed dramatically between 1961 and 2011. Newly digitised data can now show these changes locally for the first time 💻

Our article compares areas with a series of interactive maps to see what’s changed in 50 years ow.ly/Pvtk50FN6ge Census unearthed: explore 50 years of change from 1961
In some areas of England and Wales in 1961, more than half of homes didn’t have toilets indoors or attached to a property 🚽

Instead, toilet access could have been in a separate building in the garden, or sometimes, a communal toilet for the street 🧻 Homes without a toilet indoors or attached to the building i
Divorce has risen tenfold and fewer people are married 💔

⬆️ 68% of people were legally married in 1961 and 0.8% were divorced.

⬇️ In 2011, 49% were legally married or in a civil partnership, and 9% divorced or in a legally dissolved civil partnership Percentage of people who were legally married and divorced 1
The population also increased between 1961 and 2011, which could be because people are generally living longer than they did in the 1960s 👶

Rural areas became more urbanised as the population grew and cities spread 🌳

Explore our interactive map ➡️ ow.ly/kiC250FN6ow
Households had fewer people per room in 2011 than 1961 🏘

Nearly every local area as they were in 1961 has seen an increase in the number of households that have one person per room or less, showing households have more rooms available per person to live in 🚪 Households had more rooms available per person to live in in
More people owned a home in 2011 than 50 years before 🏡

⬇️ Only 43% of households owned their own home in 1961, and in some areas of central London, home ownership was lower than 10%

⬆️ In the 2011 Census, home ownership had risen to 64%

➡️ ow.ly/Hvho50FN6rO Home ownership increased by over 20 percentage points 1961 t

• • •

Missing some Tweet in this thread? You can try to force a refresh
 

Keep Current with Office for National Statistics (ONS)

Office for National Statistics (ONS) Profile picture

Stay in touch and get notified when new unrolls are available from this author!

Read all threads

This Thread may be Removed Anytime!

PDF

Twitter may remove this content at anytime! Save it as PDF for later use!

Try unrolling a thread yourself!

how to unroll video
  1. Follow @ThreadReaderApp to mention us!

  2. From a Twitter thread mention us with a keyword "unroll"
@threadreaderapp unroll

Practice here first or read more on our help page!

More from @ONS

9 Aug
We've published findings from our International Passenger Survey to understand attitudes towards #COVID19 among passengers arriving to the UK between Feb and June 2021 ow.ly/wOrt50FN5zj Attitudes towards COVID-19 among passengers arriving into th
Roughly two thirds of all UK (66%) and overseas residents (69%) interviewed said social distancing made them feel safe during their journey in June 2021.

This has remained broadly consistent since Feb 2021 ow.ly/tbfG50FN5C3 Chart title: Most UK and overseas residents said that social
The majority of UK (69%) and overseas residents (75%) interviewed in June 2021 said the wearing of face coverings made them feel safe during their journey ow.ly/TUL050FN5IR Chart title: The majority of UK and overseas residents inter
Read 6 tweets
9 Aug
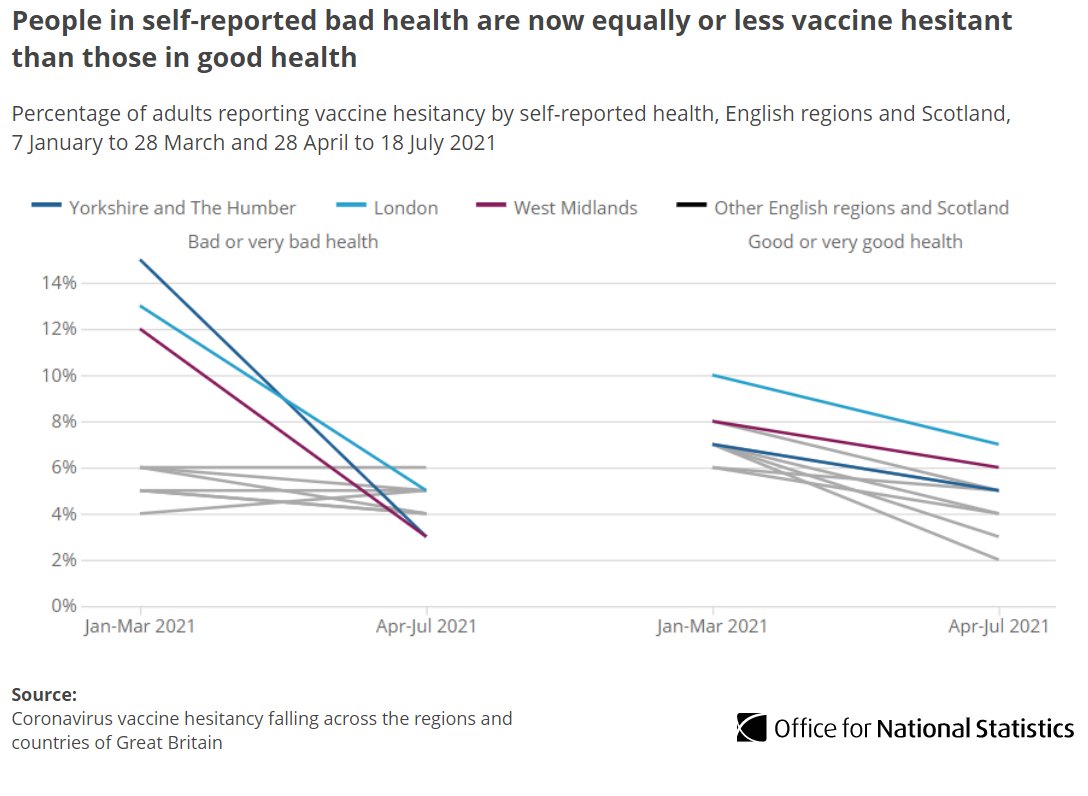
New subnational analysis highlights a widespread fall in #COVID19 vaccine hesitancy across the countries and regions of Great Britain during the first half of 2021.

(This compares data from 28 April to 18 July with data from 7 January to 28 March) ➡️ow.ly/VTHq50FN4YB
The greatest falls tended to be in areas that had the highest initial hesitancy rates, such as;

⬇️London (11% to 7%)
including Inner London East (13% to 7%), Outer London West and North West (12% to 7%)

ow.ly/i6CZ30rQshx
In April to July 2021, rates of vaccine hesitancy in some regions among people who said they were in bad health in general, were lower or similar to those reporting good health, reversing a trend seen in January to March 2021 👇
ow.ly/ZOOe30rQsjx
Read 5 tweets
9 Aug
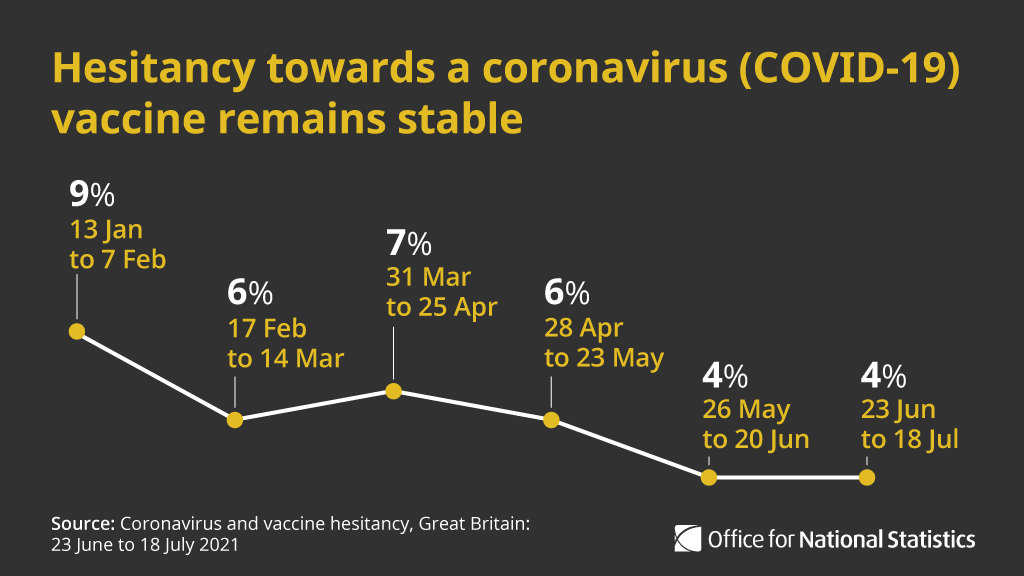
4% of adults reported hesitancy to a #COVID-19 vaccine between 23 June and 18 July 2021.

This is similar to the previous period, following a longer term trend of declining hesitancy ow.ly/SYZJ50FN4Gq Hesitancy towards a coronavirus (COVID-19) vaccine remains s
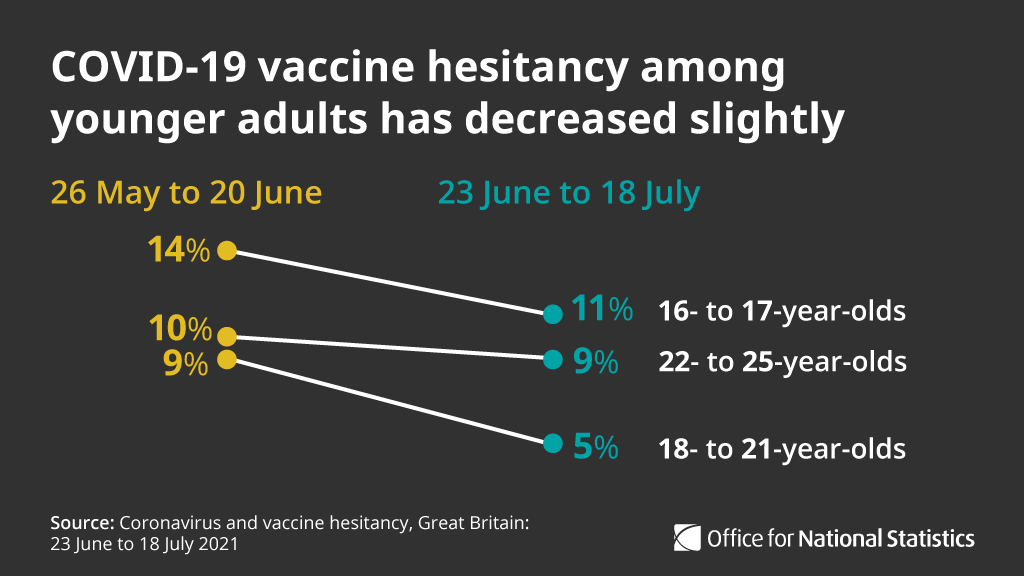
Vaccine hesitancy among younger adults appeared to have decreased slightly and in the latest period was:

▪️11% for 16-17 year-olds
▪️5% among 18-21 year-olds
▪️and 9% among those aged 22-25

➡️ ow.ly/9SQ330rQseJ
Black or Black British adults had the highest rates of vaccine hesitancy (21%) compared with White adults (4%)

Hesitancy was also higher for adults identifying Muslim (14%) or Other (14%) as their religion, compared with those identifying Christian (4%) ow.ly/caTN30rQseZ
Read 4 tweets
5 Aug
Happy #CycleToWorkDay!

We're looking at trends in bicycle transport commutes taken from 2011 Census and the 2018 Annual Population Survey 🚴

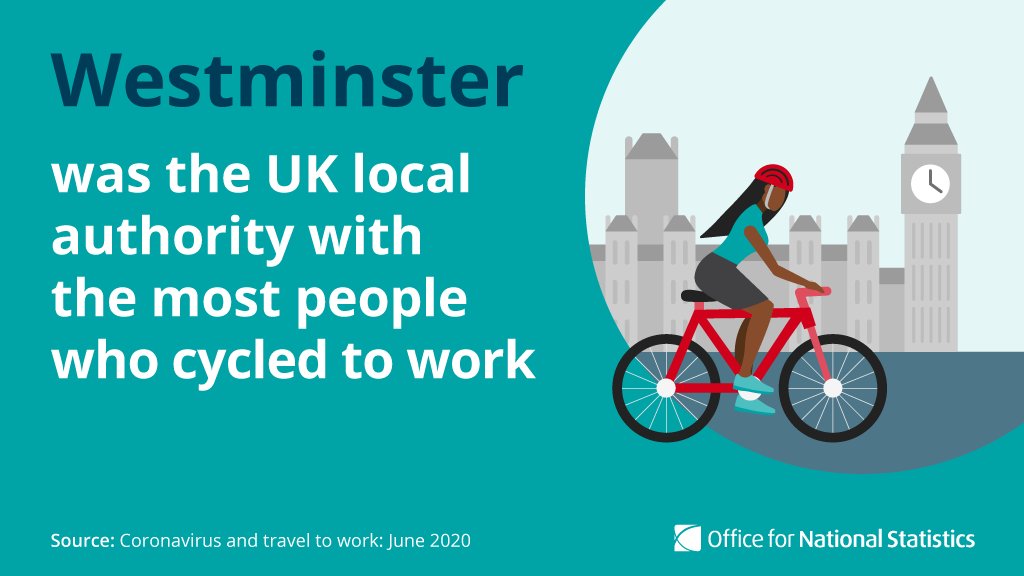
Which local authority had the most people that cycled to its workplaces?

Answer to be revealed at 1pm!
Westminster had the most people that cycled to its workplaces across all industries, at 27,240 📍ow.ly/Oik750FKXfx #CycleToWorkDay Westminster was the UK local authority with the most people
The top 3 industries where its employees were most likely to travel to work by bicycle were:

- entertainment and recreation: 4.2%
- education: 3.8%
- information and communication: 3.8%

➡️ ow.ly/eZpm50FKXlY

#CycleToWorkDay
Read 5 tweets
5 Aug
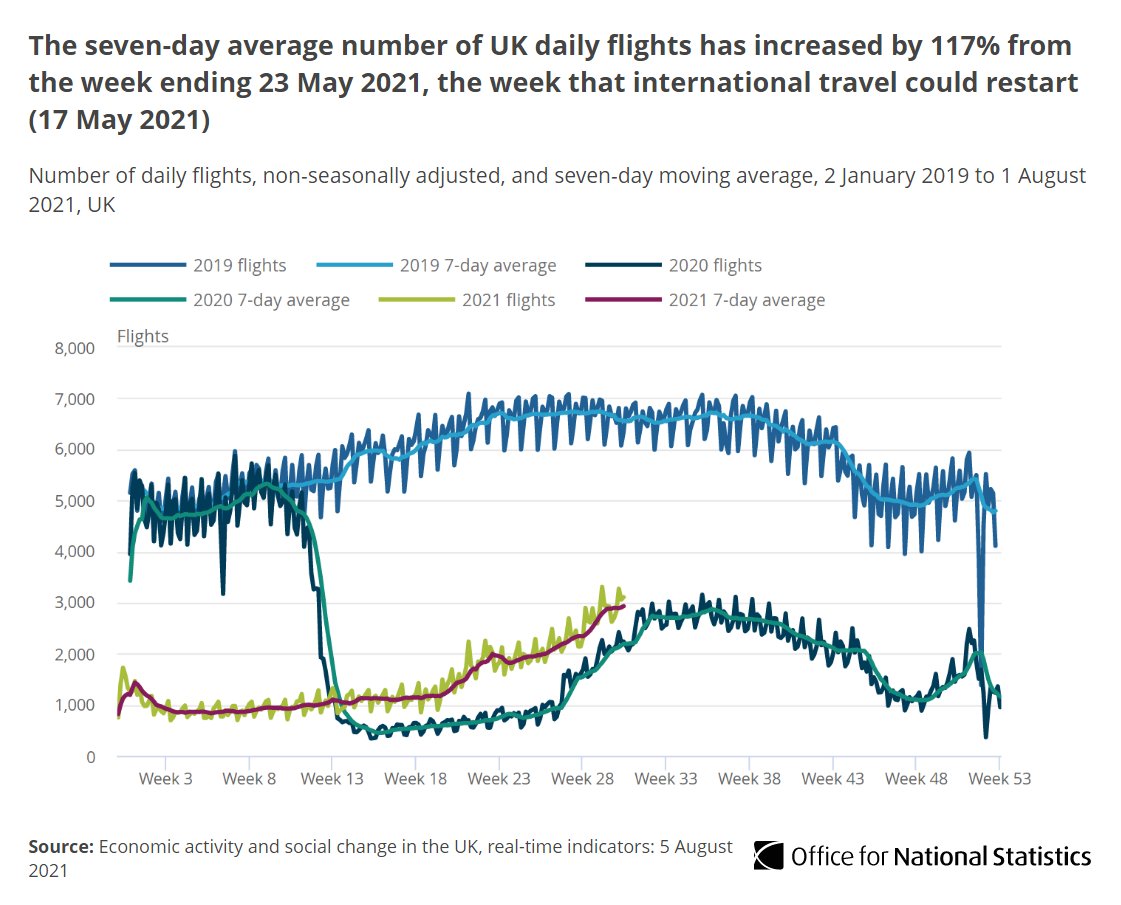
The 7-day average number of UK daily flights in the week to 1 August rose 2% from the previous week, @eurocontrol data show.

This is now up 117% from the week ending 23 May 2021 when international travel restarted with the UK travel traffic light system ow.ly/oKGn50FKPy3 Line chart showing the seven-day average number of UK daily
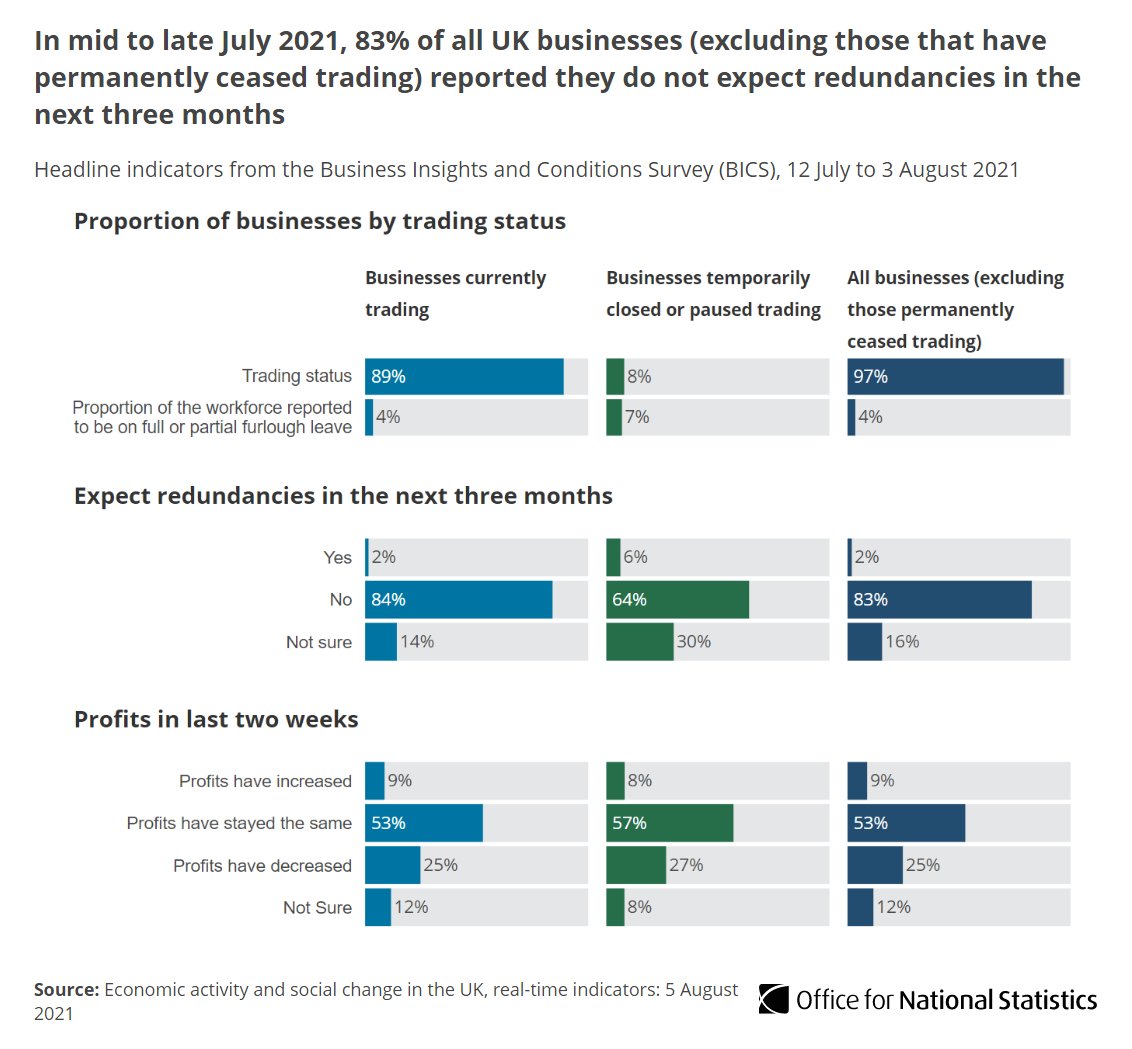
@eurocontrol 25% of UK businesses in mid-July 2021 saw a fall in turnover compared with what is normally expected at this time of year, according to the Business Insights and Conditions Survey.

This is the lowest proportion seen since the series began in June 2020 ow.ly/8EnW50FKPAJ Chart showing in mid to late July 2021, 83% of all UK busine
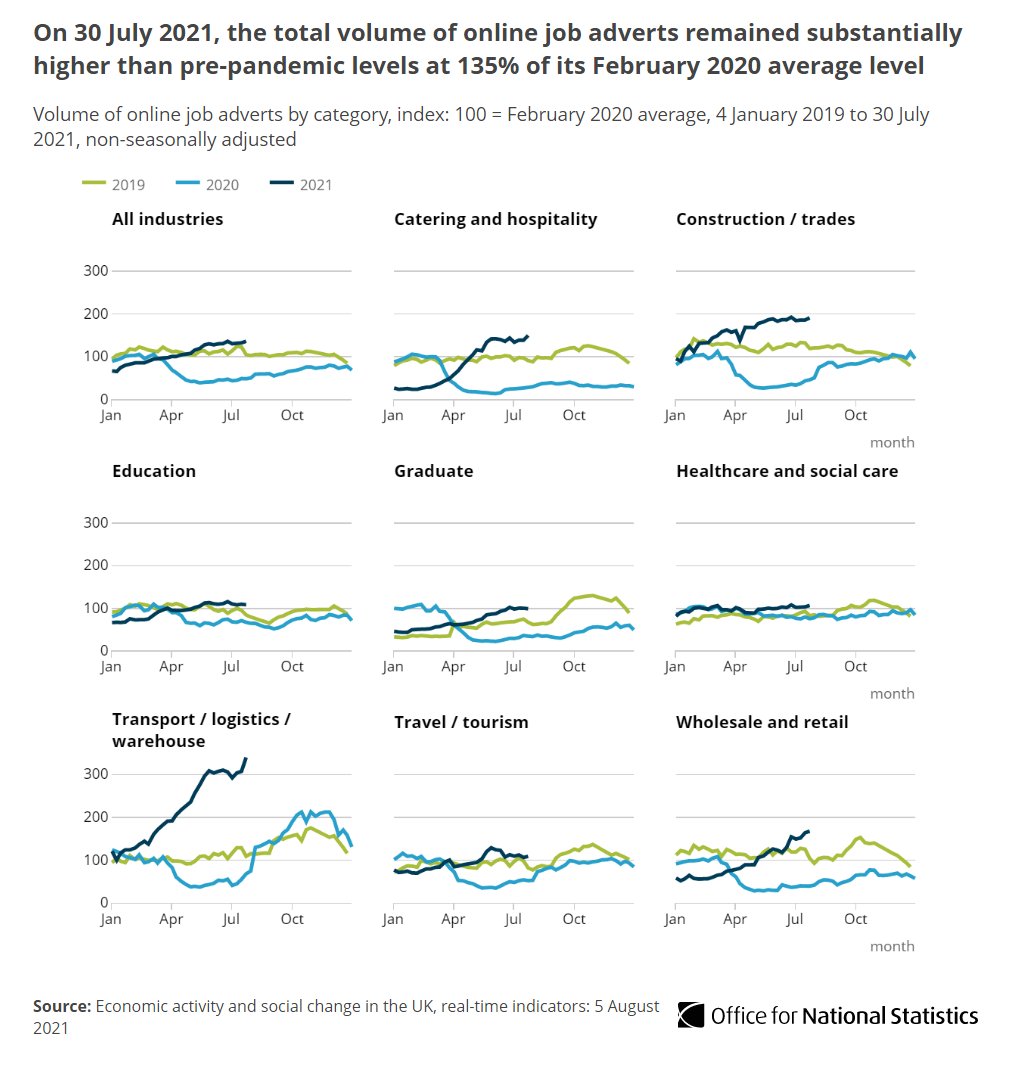
@eurocontrol The volume of online job adverts on 30 July 2021 increased by 3% since last week and was 135% of its Feb 2020 average, according to @Adzuna.

The biggest weekly increase was in the transport/logistics/warehouse category (up 11% over the latest week) ow.ly/wvPA50FKPGt Line chart showing on 30 July 2021, the total volume of onli
Read 4 tweets
5 Aug
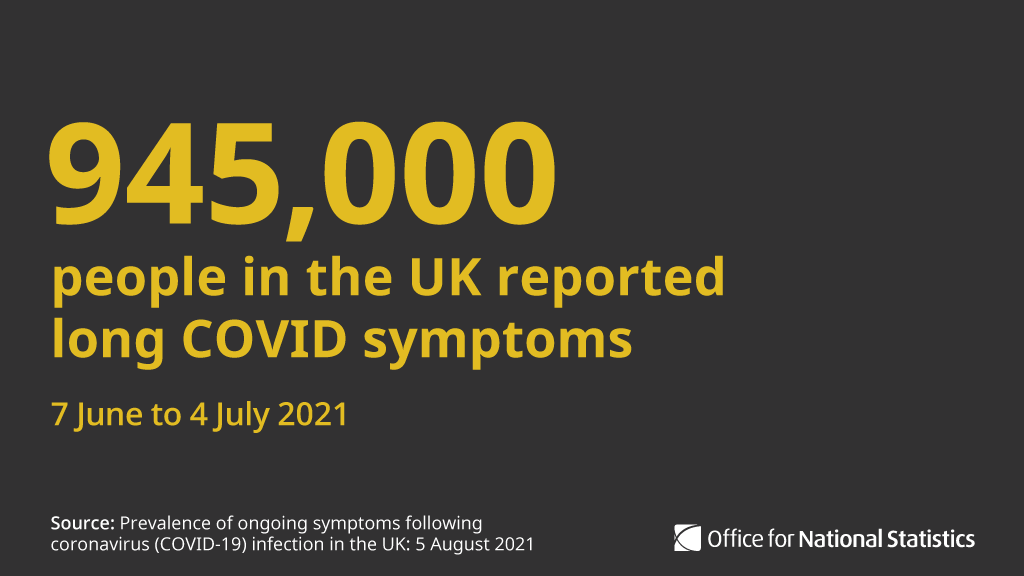
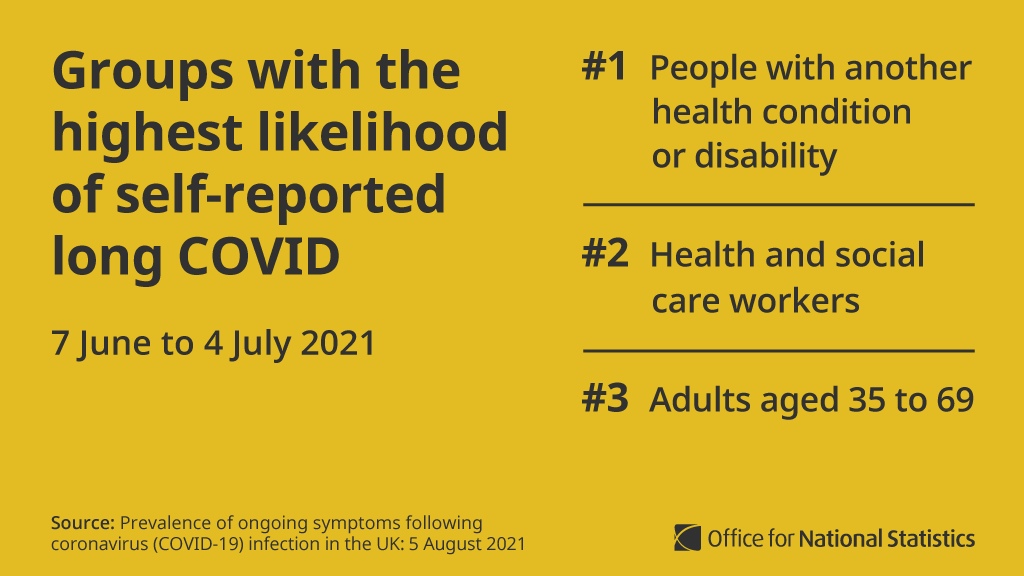
An estimated 945,000 people experienced self-reported long COVID in the 4 weeks to 4 July (where symptoms persisted more than 4 weeks after the first suspected infection) ow.ly/csTl50FKP4w Graphic with text as follows: 945,000 people in the UK repor
Self-reported long COVID was most likely among people

▪️ aged 35 to 69
▪ wh️o are female
▪️ living in the most deprived areas
▪️ working in health or social care
▪️ with another health condition or disability

➡️ow.ly/oTLo30rQ1ZF
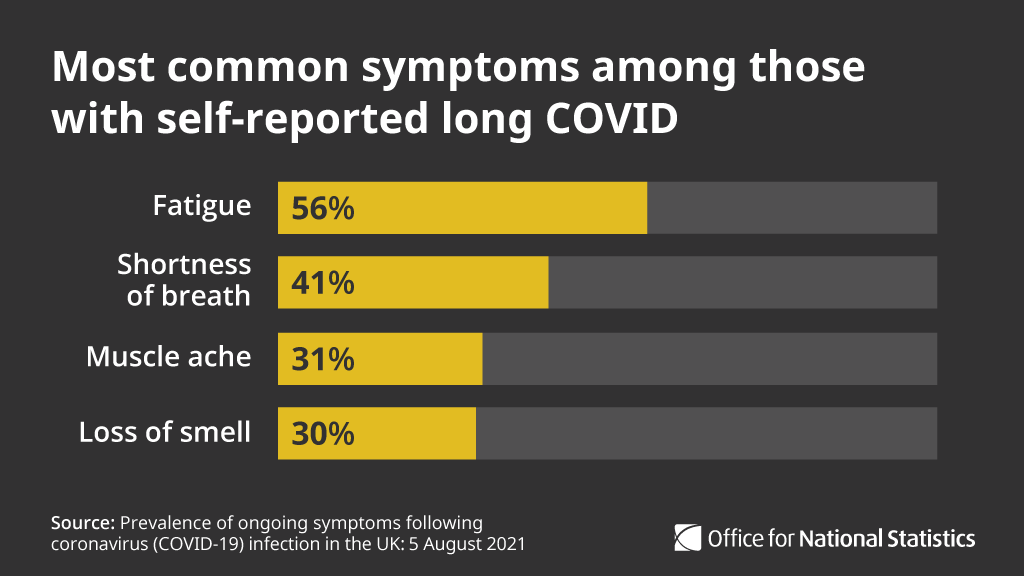
The most common self-reported symptoms of long COVID were

▪️ fatigue
▪️ shortness of breath
▪️ muscle ache
▪️ loss of smell

➡️ow.ly/qmz030rQ1ZM
Read 5 tweets

Did Thread Reader help you today?

Support us! We are indie developers!


This site is made by just two indie developers on a laptop doing marketing, support and development! Read more about the story.

Become a Premium Member ($3/month or $30/year) and get exclusive features!

Become Premium

Too expensive? Make a small donation by buying us coffee ($5) or help with server cost ($10)

Donate via Paypal Become our Patreon

Thank you for your support!

Follow Us on Twitter!

:(