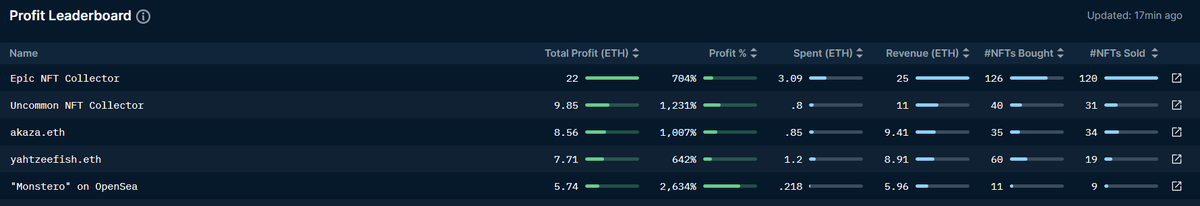
Best NFT trades come from following the smart money. You can have 100 people spamming Discord with memes, but whales decide the bottom/top.
A look at @PartyPenguinNFT and @alphabettyNFT using @nansen_ai
A look at @PartyPenguinNFT and @alphabettyNFT using @nansen_ai
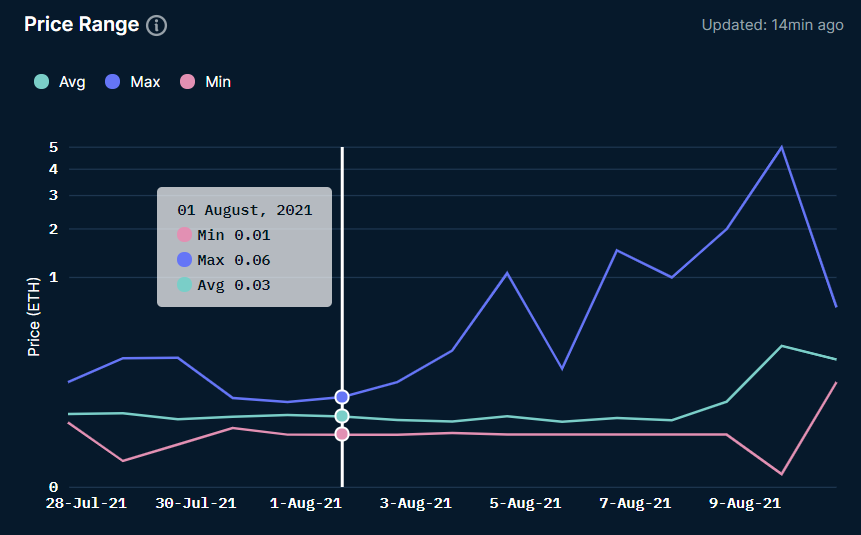
1. @PartyPenguinNFT originally had a 0.03 mint price (excl. gas) and was down bad for holders (~66% down) for a few days. Yet top whales continued to have diamond hands till it sold out, then dumped for a strong 7-10x ROI. 
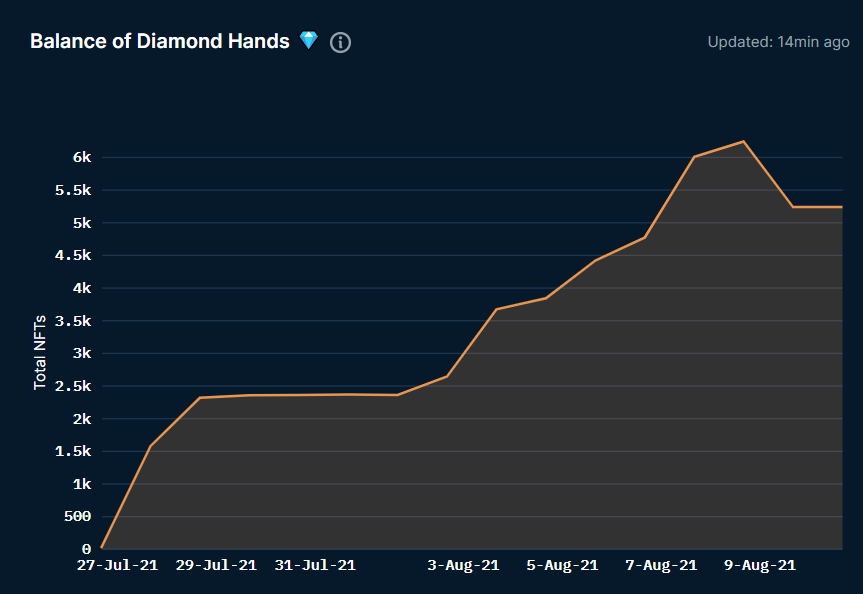
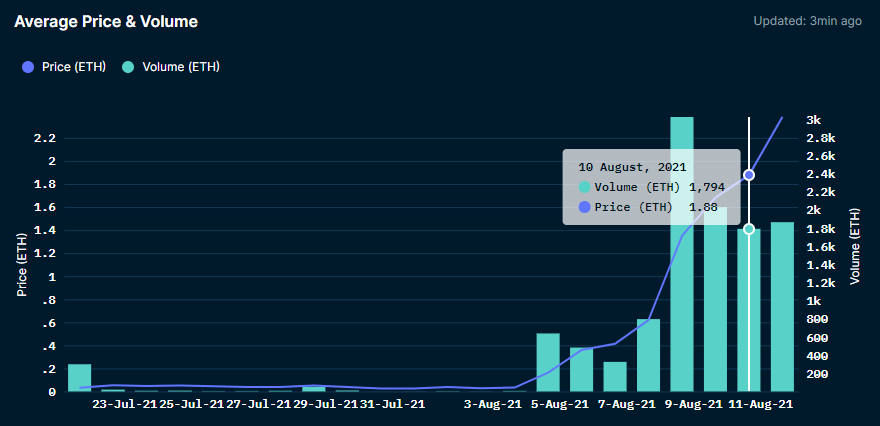
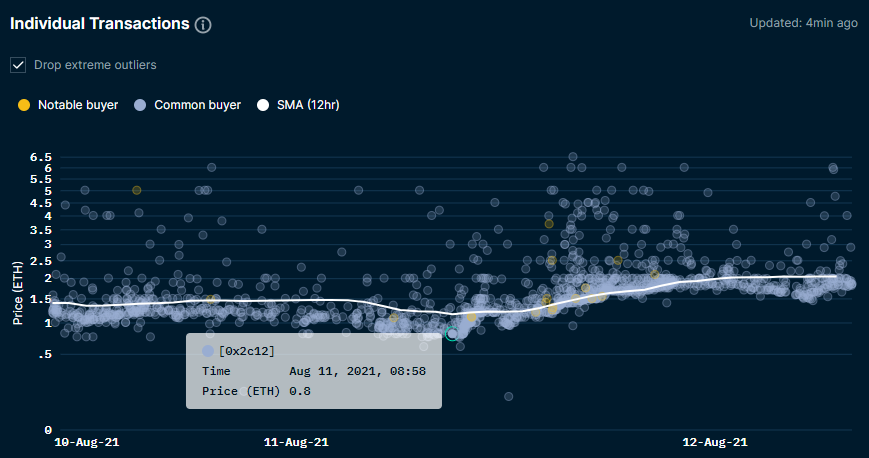
2. @alphabettyNFT had a 0.03 mint price (excl. gas) and experienced volatility as flippers sold. Top holders though continued to hold and account for 68% supply. And now the price seems to be trending up as they shill.
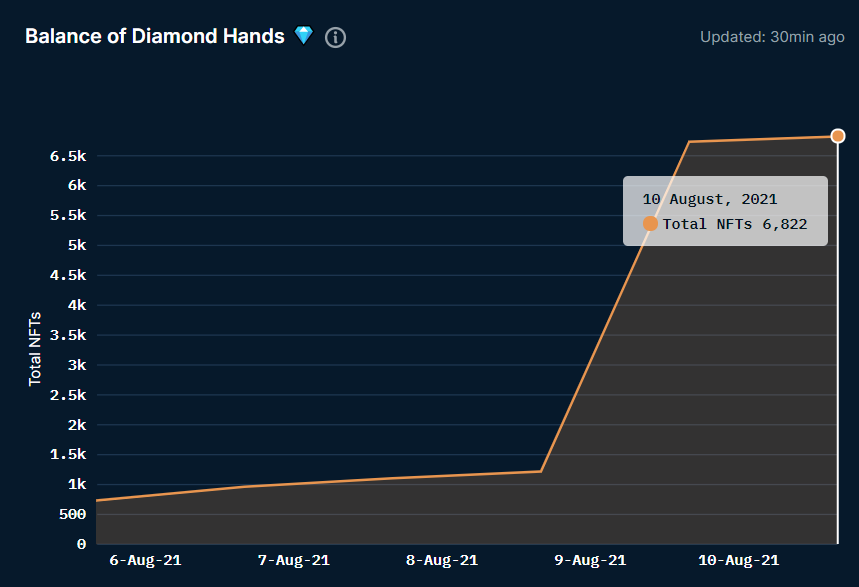
So the next time you panic sell, check the data as whales are probably buying and holding.
And when influencers shill you a project, check the data as you're probably exit liquidity.
And when influencers shill you a project, check the data as you're probably exit liquidity.
tldr;
Bid 0.01 USDC for top 100 rares, as buying panic sold rares is a risk free high beta play.
Bid 0.01 USDC for top 100 rares, as buying panic sold rares is a risk free high beta play.
• • •
Missing some Tweet in this thread? You can try to
force a refresh