Applying technical analysis to NFTs?
Analysis of @pudgy_penguins, @alphabettyNFT, and @PurrnelopesCC using @nansen_ai.
Analysis of @pudgy_penguins, @alphabettyNFT, and @PurrnelopesCC using @nansen_ai.
1. Illiquidity of NFTs fundamentally causes significant volatility.
Price action reflects emotional biases:
liquidation cascade => flipper/panic sellers realize their life savings are in jpegs
up only => price discovery/FOMO further fueled by canceled listings
Price action reflects emotional biases:
liquidation cascade => flipper/panic sellers realize their life savings are in jpegs
up only => price discovery/FOMO further fueled by canceled listings
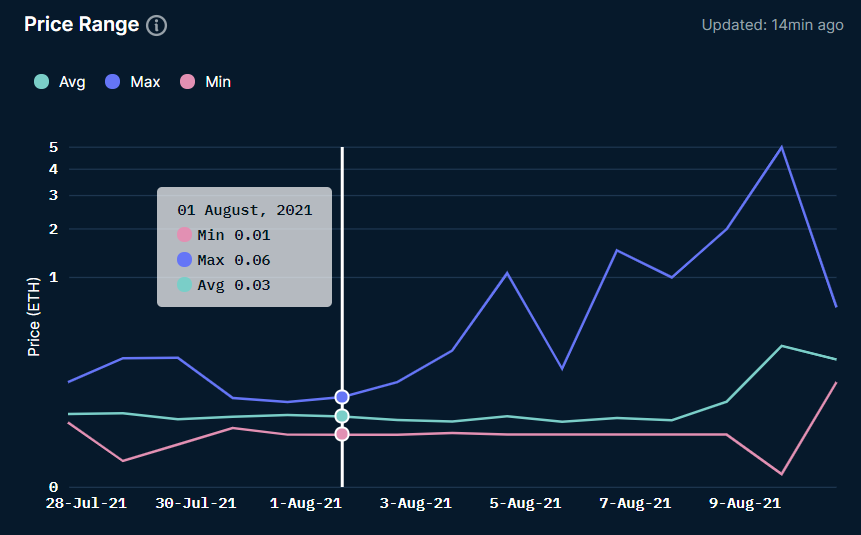
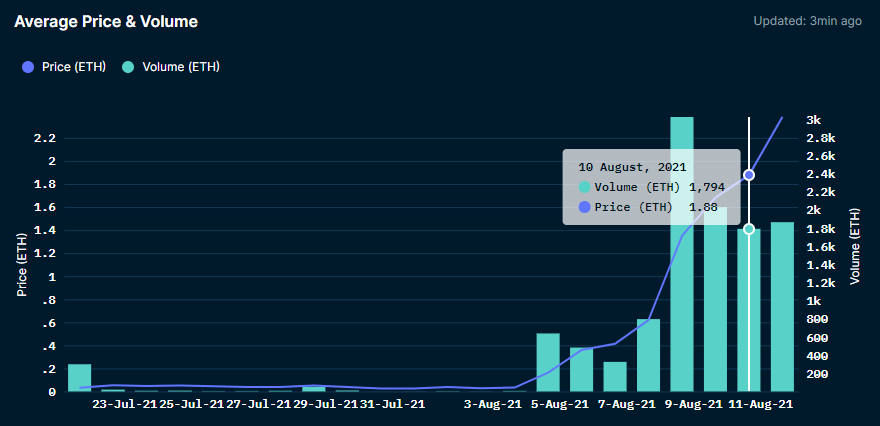
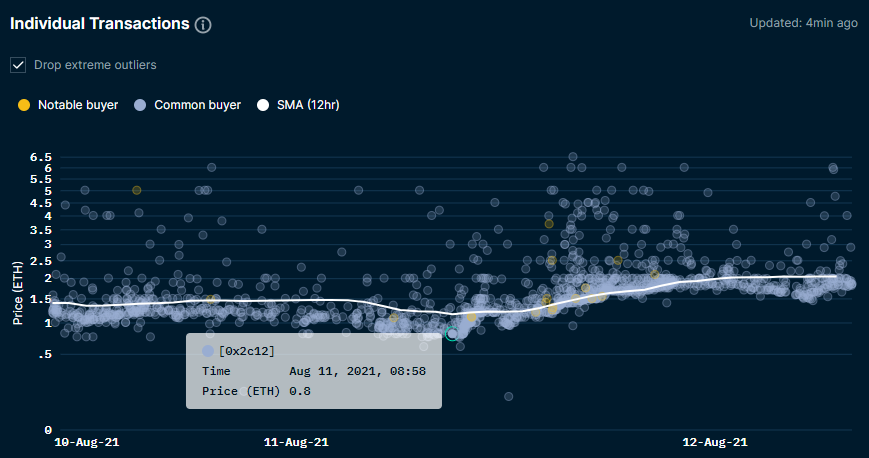
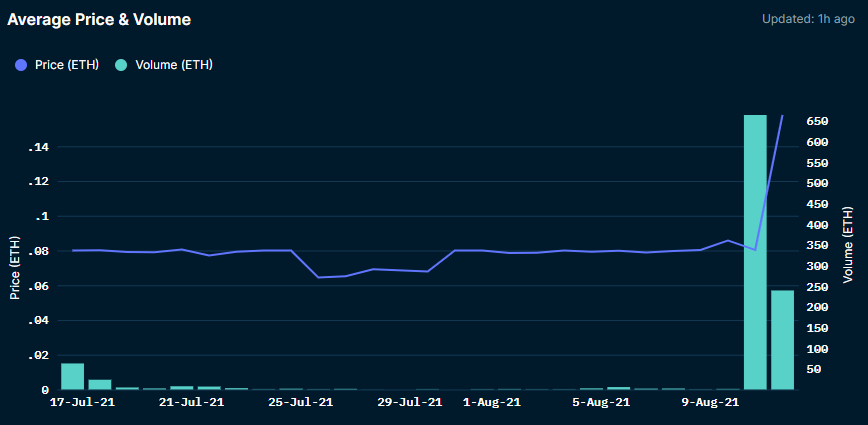
2. Besides looking at the price floor, SMA is a nice way to confirm demand zones and predict momentum.
@pudgy_penguins sat near the 0.8-1 ETH demand zone, after a breakout with significant volume, before trending higher.
@pudgy_penguins sat near the 0.8-1 ETH demand zone, after a breakout with significant volume, before trending higher.
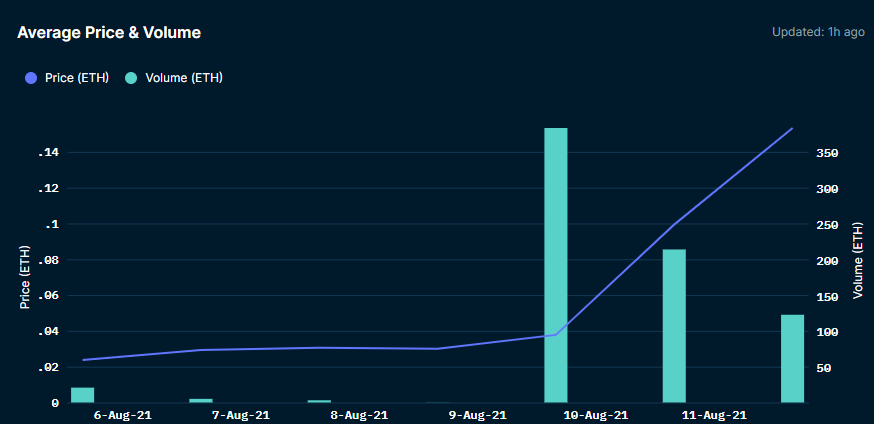
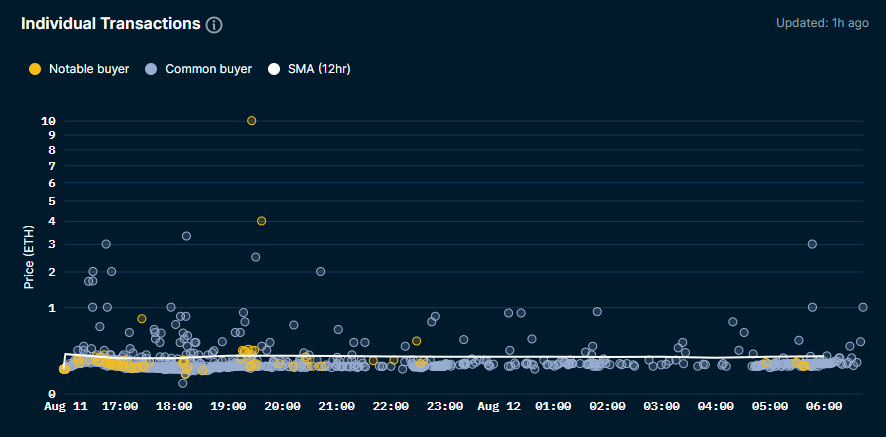
3. @alphabettyNFT continues to trend higher in both avg. price and volume. Significant amount of buys above SMA, implies that people are chasing beta via rares.
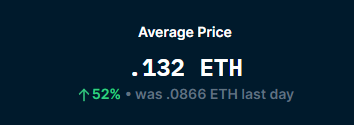
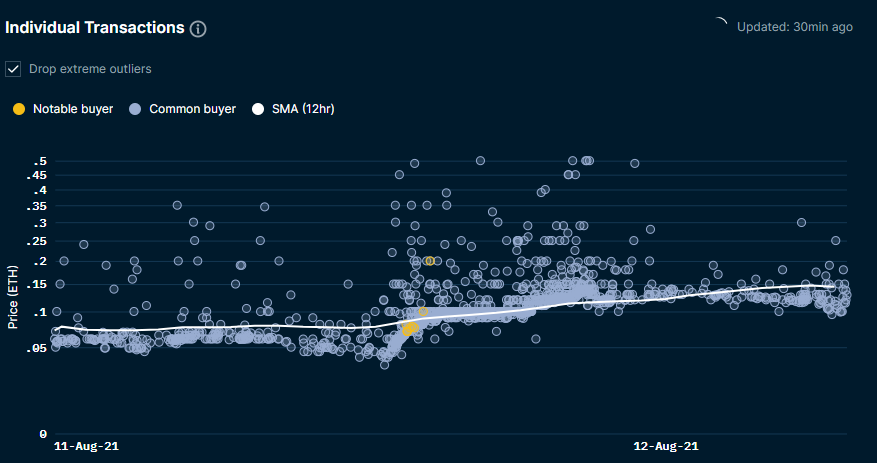
4. @PurrnelopesCC just sold out yesterday, so not much secondary data. Price floor is above the 0.08 mint price and there are a decent amount of buys above SMA, as people buy rares.
tldr;
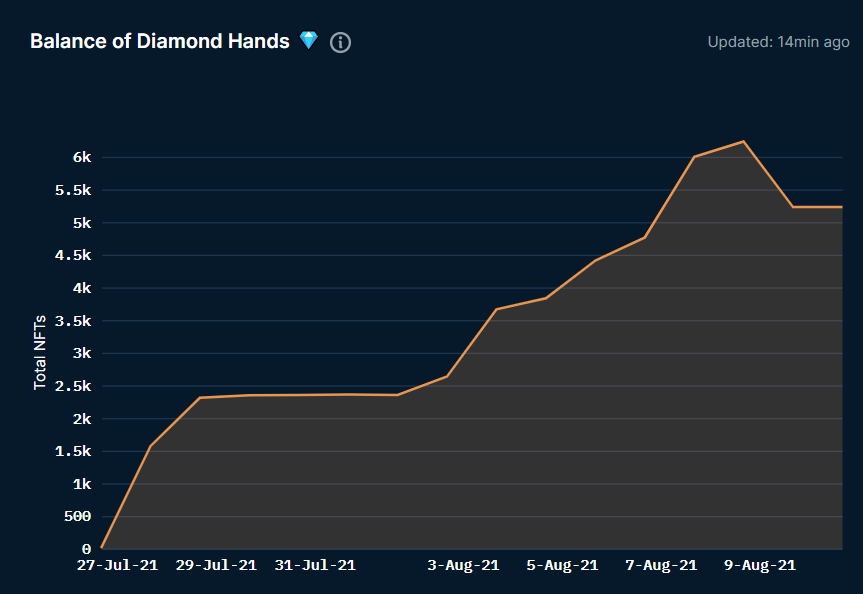
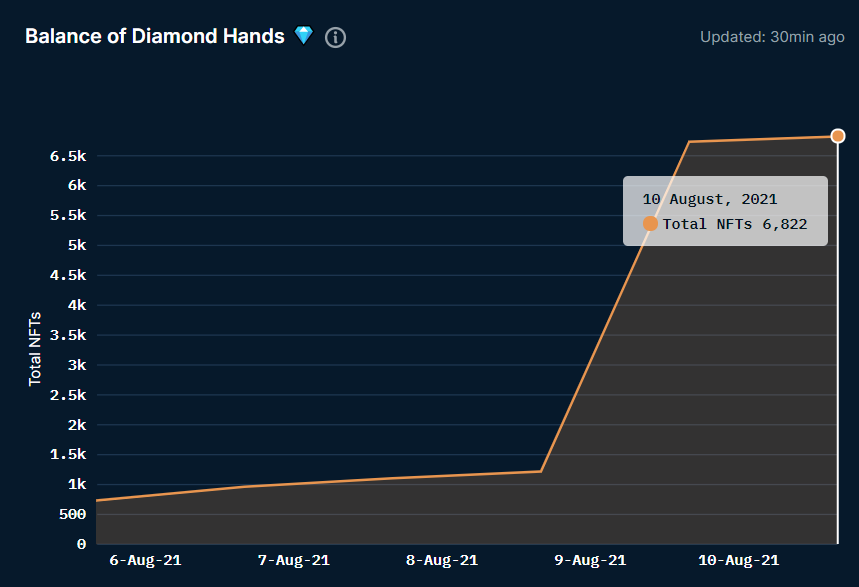
Combine SMA, volume, top balances & changes to predict price action. @trackmyhashtag can also be used to see twitter trends.
Combine SMA, volume, top balances & changes to predict price action. @trackmyhashtag can also be used to see twitter trends.
• • •
Missing some Tweet in this thread? You can try to
force a refresh