We have yet to see vaccines in NSW bring the transmission rate down. Why? A thread. 1/10
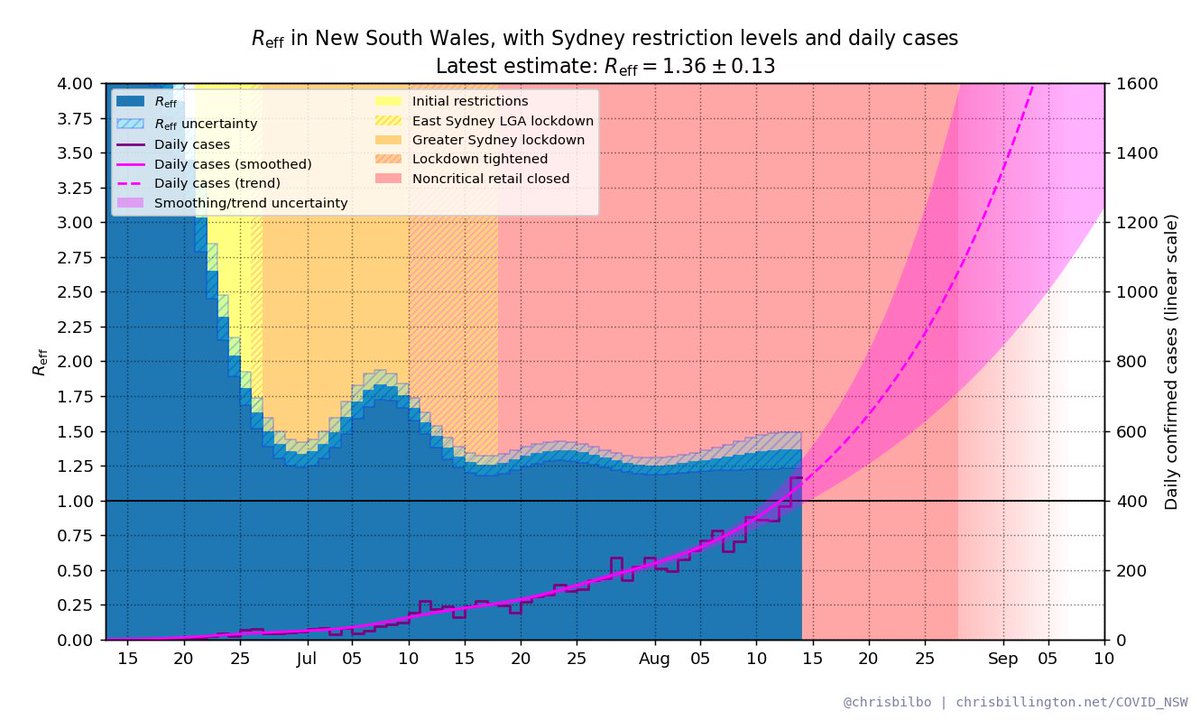
Here are these projections I've been making, where I start with the current R_eff, and assume it will decrease as vaccines in NSW ramp up and reduce transmission.

You may notice the problem - they project R_eff decrease steadily. But that's not what we're seeing. 2/10 Image
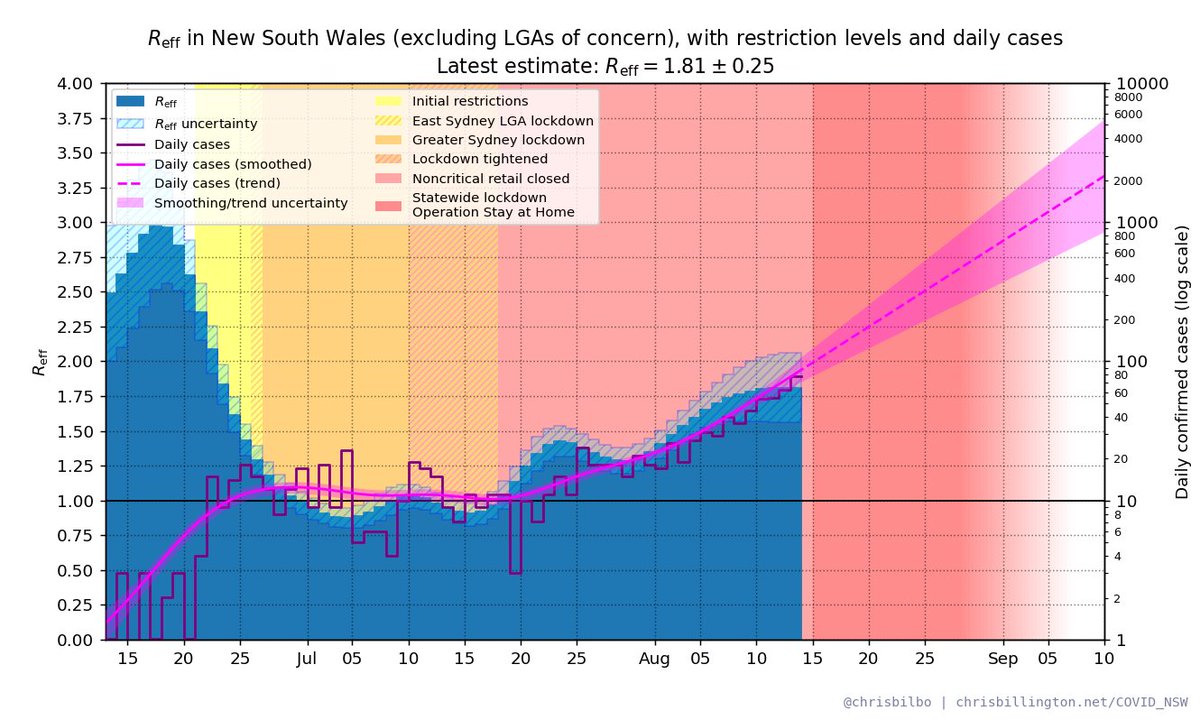
The problem is that the projection model treats NSW all the same, when in reality there are two very different settings. In the LGAs of concern, cases are higher and the growth rate lower. Elsewhere, cases are lower, but growth is higher (note: cases plotted on a log scale) 3/10 ImageImage
Although the LGAs of concern are dominating the overall trend right now, the faster growth rate in the rest of NSW is contributing more and more to the overall growth rate over time as case numbers there rise. 4/10
This pushes the state's overall growth rate in case numbers gradually upward, away from the lower growth rate of the LGAs of concern, and toward the higher growth rate of the rest of NSW. 5/10
I can run exactly the same kind of projection of the vaccine rollout, but treat the LGAs of concern and the rest of NSW as if they were two separate outbreaks, starting from their individual R_eff values that we see now, projecting forward then adding them together. 6/10
If I do that, I see that in the short-term, the decrease in the overall R_eff from vaccines is almost exactly cancelled out by this effect of the higher R_eff outside the LGAs of concern slowly taking over: see the flat projection for R_eff in the short-term below. 7/10 Image
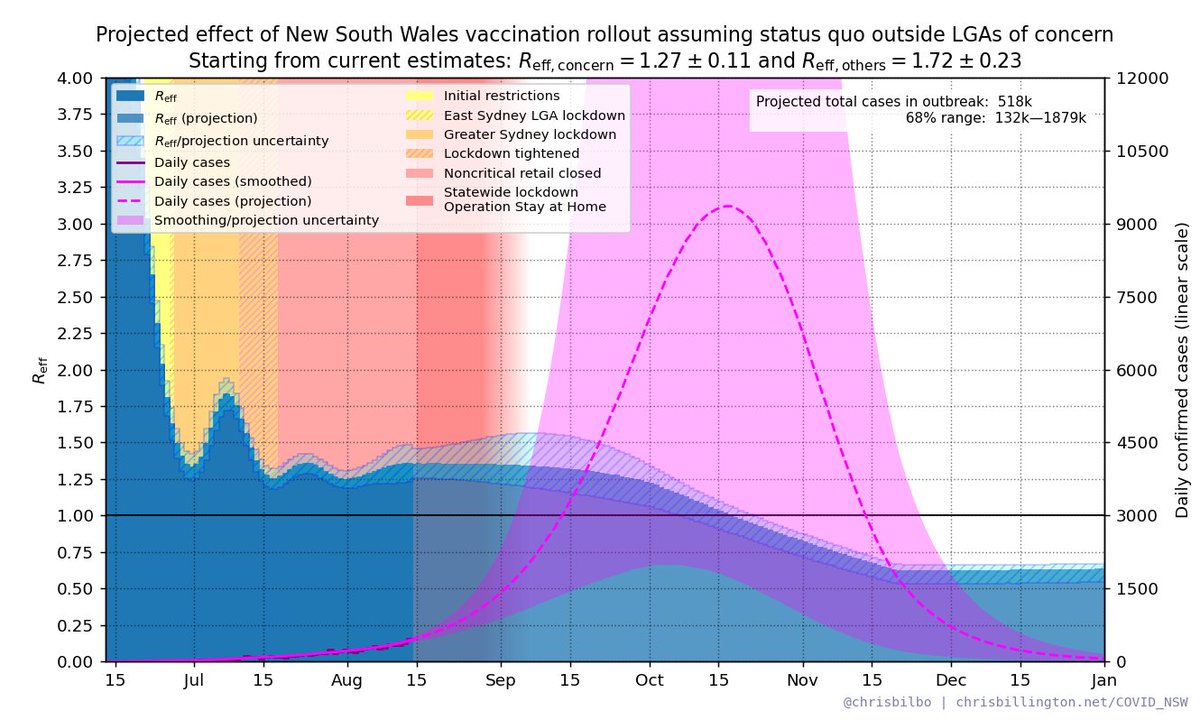
The longer-term (very concerning) part of the above projection is not realistic, since the NSW government will presumably impose extra restrictions on these areas once cases are higher (but knowing that, why not do it now...?) 8/10
But I hope this goes some way to explaining why we're not seeing vaccinations affect the overall growth rate quite yet. There is no overall growth rate. There are two Sydneys right now, and overall growth won't be low until it's low everywhere. 9/10
More info on some of these projections can be found on my page here: chrisbillington.net/COVID_NSW.html 10/10
As @DanDbab points out, most of the discrepancy at the moment is explained by three regional LGAs, *not* the areas of greater Sydney outside the LGAs of concern as I assumed.

This changes things a bit, as lockdowns are more recent in these areas. High growth rates without lockdown are no surprise at all, and we should wait to see the effects of regional lockdowns before drawing any more conclusions.

• • •

Missing some Tweet in this thread? You can try to force a refresh
 

Keep Current with Chris Billington

Chris Billington Profile picture

Stay in touch and get notified when new unrolls are available from this author!

Read all threads

This Thread may be Removed Anytime!

PDF

Twitter may remove this content at anytime! Save it as PDF for later use!

Try unrolling a thread yourself!

how to unroll video
  1. Follow @ThreadReaderApp to mention us!

  2. From a Twitter thread mention us with a keyword "unroll"
@threadreaderapp unroll

Practice here first or read more on our help page!

More from @Chrisbilbo

16 Aug
NSW R_eff as of Aug 16th with daily cases and Sydney restrictions. Latest estimate: R_eff = 1.33 ± 0.12

Plus projected effect of vaccination rollout.

Cases shown on a linear scale (log scale in next tweet).

More info chrisbillington.net/COVID_NSW.html

#covid19nsw #covidsydney ImageImage
NSW R_eff as of Aug 16th with daily cases and Sydney restrictions. Latest estimate: R_eff = 1.33 ± 0.12

Plus projected effect of vaccination rollout.

(Cases shown on a log scale)

More info chrisbillington.net/COVID_NSW.html

#covid19nsw #covidsydney ImageImage
R_eff in LGAs of concern* (*all of Penrith included) vs the rest of NSW:

LGAs of concern: R_eff = 1.32 ± 0.12
Rest of NSW: R_eff = 1.81 ± 0.25

(Cases shown on a log scale)

#covid19nsw #covidsydney ImageImage
Read 5 tweets
15 Aug
NSW R_eff as of Aug 15th with daily cases and Sydney restrictions. Latest estimate: R_eff = 1.33 ± 0.12

Plus projected effect of vaccination rollout.

Cases shown on a linear scale (log scale in next tweet).

More info chrisbillington.net/COVID_NSW.html

#covid19nsw #covidsydney ImageImage
NSW R_eff as of Aug 14th with daily cases and Sydney restrictions. Latest estimate: R_eff = 1.33 ± 0.12

Plus projected effect of vaccination rollout.

(Cases shown on a log scale)

More info chrisbillington.net/COVID_NSW.html

#covid19nsw #covidsydney ImageImage
R_eff in LGAs of concern* vs the rest of NSW (*all of Penrith counted as an LGA of concern):

LGAs of concern: R_eff = 1.27 ± 0.11
Rest of NSW: R_eff = 1.72 ± 0.23

(Cases shown on a log scale)

#covid19nsw #covidsydney ImageImage
Read 4 tweets
14 Aug
NSW R_eff as of Aug 14th with daily cases and Sydney restrictions. Latest estimate: R_eff = 1.36 ± 0.13

Plus projected effect of vaccination rollout.

Cases shown on a linear scale (log scale in next tweet).

More info chrisbillington.net/COVID_NSW.html

#covid19nsw #covidsydney ImageImage
NSW R_eff as of Aug 14th with daily cases and Sydney restrictions. Latest estimate: R_eff = 1.36 ± 0.13

Plus projected effect of vaccination rollout.

(Cases shown on a log scale)

More info chrisbillington.net/COVID_NSW.html

#covid19nsw #covidsydney ImageImage
R_eff in LGAs of concern* vs the rest of NSW (*all of Penrith counted as an LGA of concern):

LGAs of concern: R_eff = 1.25 ± 0.11
Rest of NSW: R_eff = 1.70 ± 0.22

(Cases shown on a log scale)

#covid19nsw #covidsydney ImageImage
Read 4 tweets

Did Thread Reader help you today?

Support us! We are indie developers!


This site is made by just two indie developers on a laptop doing marketing, support and development! Read more about the story.

Become a Premium Member ($3/month or $30/year) and get exclusive features!

Become Premium

Too expensive? Make a small donation by buying us coffee ($5) or help with server cost ($10)

Donate via Paypal Become our Patreon

Thank you for your support!

Follow Us on Twitter!

:(