Dear Cathie, I was surprised at the indignity of seeing a high-profile investor short your largest product, so sought to determine why. Examining the $ARKK June 30 Factsheet, it appears devoid of what some investors refer to as “fundamental data.” Important? Let's see...1/ 
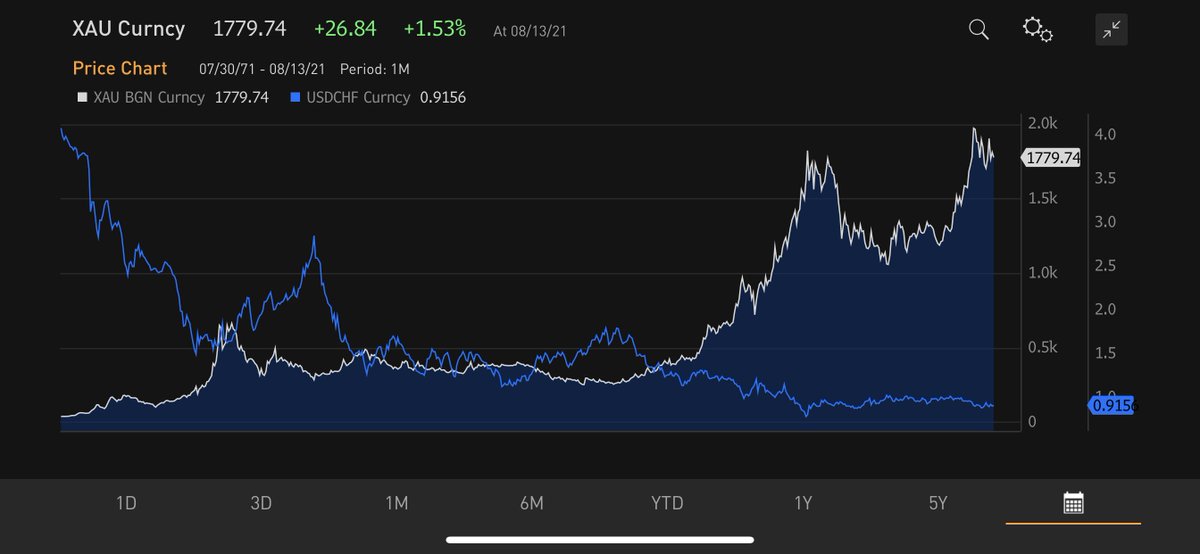
I see your performance, which is really good, except for this year. Looks like you're actually now down 6.9% for the year. I took briefly to the Bloomberg and other sources to decipher these metrics. What I concluded is you and your team must be counting on growth. Lots of it. 2/
To wit, a calculation for portfolio price to earnings yields a NMF, which must mean the portfolio holdings, aggregated as though a single business, lose money. It appears only 14 of the 51 report a profit. It seems like a lot, but in the realm of disruptors and "but Amazon"...3/
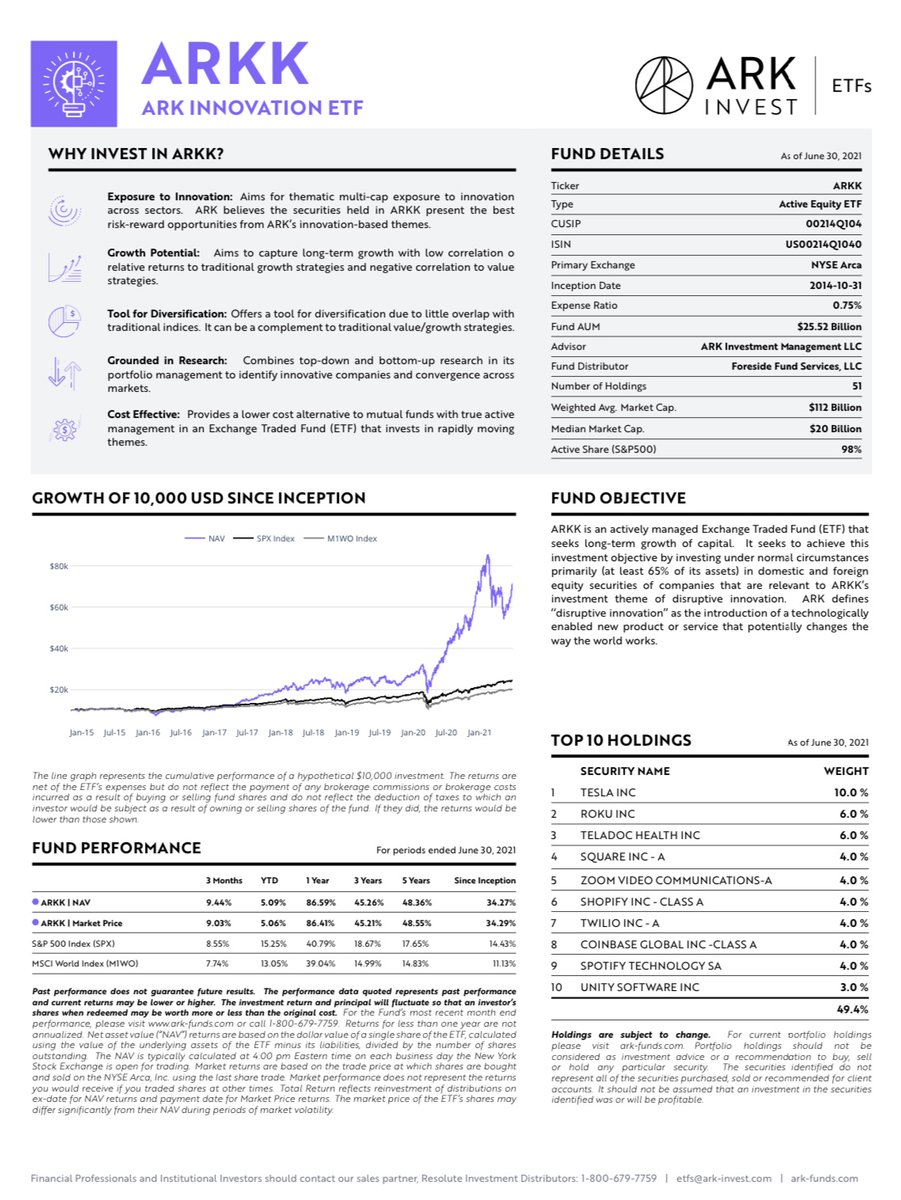
The good news is 6 the companies actually making money (profits, not necessarily a return on equity above a cost of equity) are in your top 10 holdings, which comprise 49.4% of portfolio assets. The bad news is the P/Es are somewhat higher than I’m accustomed to seeing. 4/
According to Bloomberg, here are the P/E multiples for your top ten holdings, all triple-digit (for the ones making money):
Tesla 655x
Roku 596x
Teladoc NMF (loss)
Square 677x
Zoom 125x
Shopify 426x
Spotify NMF (loss)
Twilio NMF (loss)
Coinbase 158x
Unity Software NMF (loss)
5/
Tesla 655x
Roku 596x
Teladoc NMF (loss)
Square 677x
Zoom 125x
Shopify 426x
Spotify NMF (loss)
Twilio NMF (loss)
Coinbase 158x
Unity Software NMF (loss)
5/
Ok. We all know from my recent exchanges with @10kdiver & @AlbertBridgeCap that exceedingly high P/Es distort portfolio averages. Using a harmonic mean adjusts for the outliers. In finance, a harmonic mean simply calculates a cap-weighted average of component earnings yields. 6/
The measure derives a more appropriate P/E via the inverse of the earnings yield. Unfortunately, your portfolio companies produce an aggregate loss, and coupled with high prices gets you a NEGATIVE 1.2% earnings yield. I’ve never seen this in a portfolio of public equities. 7/
$25.5B of market value for the portfolio produces an aggregated loss of $307 million, and we’re not in a deep recession or depression. Wow. The portfolio P/E becomes NMF, because you have a positive price as the numerator and negative earnings for the denominator. Remarkable. 8/
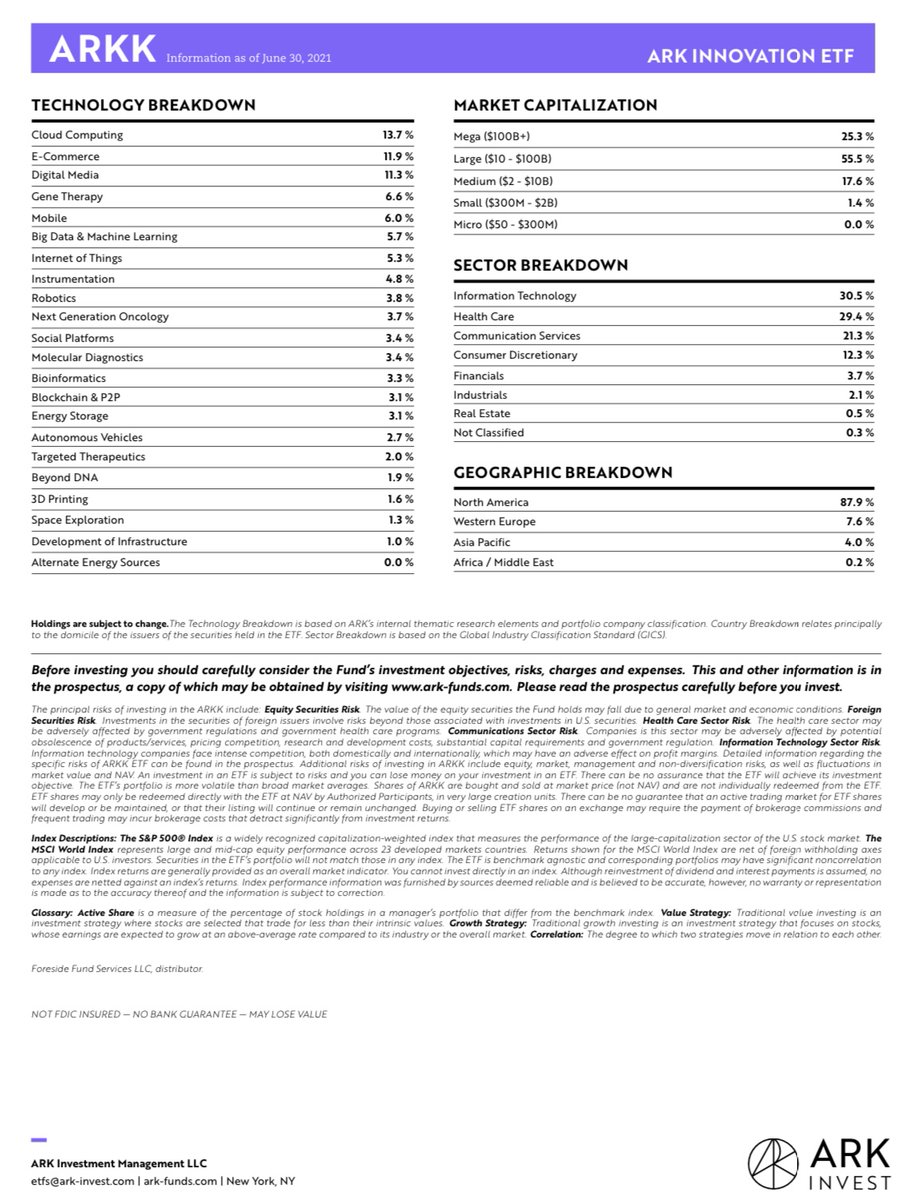
Given that profits appear on the come, perhaps it’s better to evaluate price to cashflow. Unfortunately, again, with 25 of the 51 holdings producing NEGATIVE cashflow, the generally trusty Bloomberg calculates a multiple of 298x. Whoa. Back to the harmonic. 9/
I’m not doing the math, but if you have cash flow estimates for each holding, it would be easy for your team to come up with an appropriate harmonic multiple to cashflow. Bloomberg doesn’t like negative cashflow so their number is likely wrong at the portfolio level. 10/
There are some in investing circles deriving value with a dividend discount model. With only 6 of 51 companies paying a dividend and none in the top 28, the yield of 0.0% (rounded of course) doesn’t produce much for the shareholder, particularly net of your 0.75% mgmt. fee. 11/
With virtually no portfolio dividends (and negative earnings at present) you’re really going to need that g! Perhaps value can be examined as your 8.4 multiple to book value. Compared to the S&P 500’s P/B of 4.6x (an all-time high), yours is less than double the market. Hey. 12/
The problem with the BV of so many of your holdings is the downward distortion from cumulative losses produced by the companies. An enormous amount of capital raised has been chewed up by cash burn, which makes the retained earnings component of shareholder’s equity negative. 13/
I like assessing return on equity and on capital against the multiple paid for each and against the cost. It’s nice when a company produces profit on equity in excess of the cost of that equity and INCLUSIVE of all equity capital raised. Ditto for measuring return on capital. 14/
The “additional paid in capital” component of equity is much higher than BV. Good news that your companies are adept at raising ongoing money, selling new stock to investors at high prices as well as finding lenders willing to lend on cash burn. Ignoring SBC entirely here. 15/
Portfolio debt to equity of only 28% understates balance sheet health as net debt to equity is sizably negative, meaning the companies have more cash on hand than they do debt outstanding. Good. Money to burn, they say! These are not cash generating machines, at least so far. 16/
While I’ve not made the Semper factsheet a public document in the past, I’m attaching it here in case you would like to use the “Portfolio Fundamentals” template, seen right at the top of the first page. I run a more comprehensive common-size analysis in my annual letter. 17/
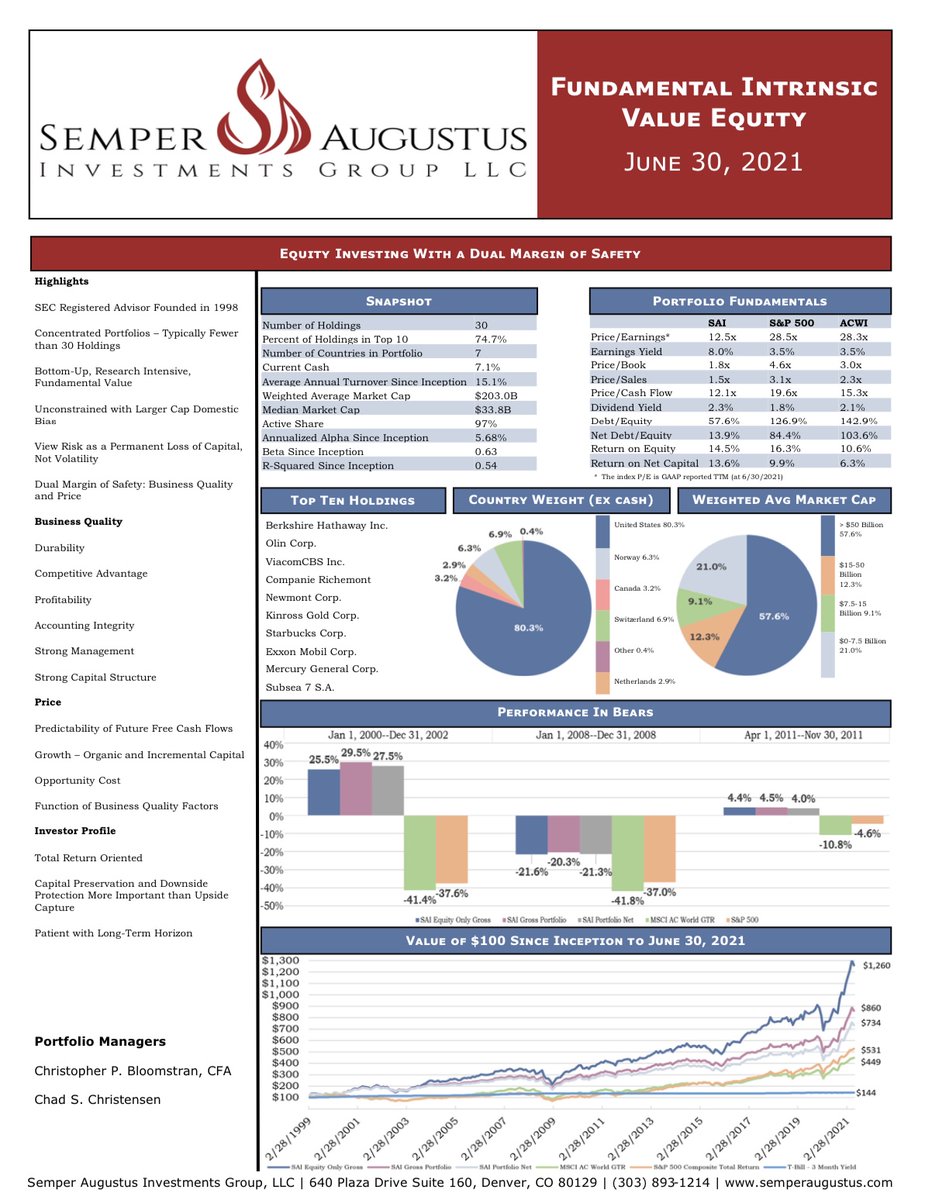
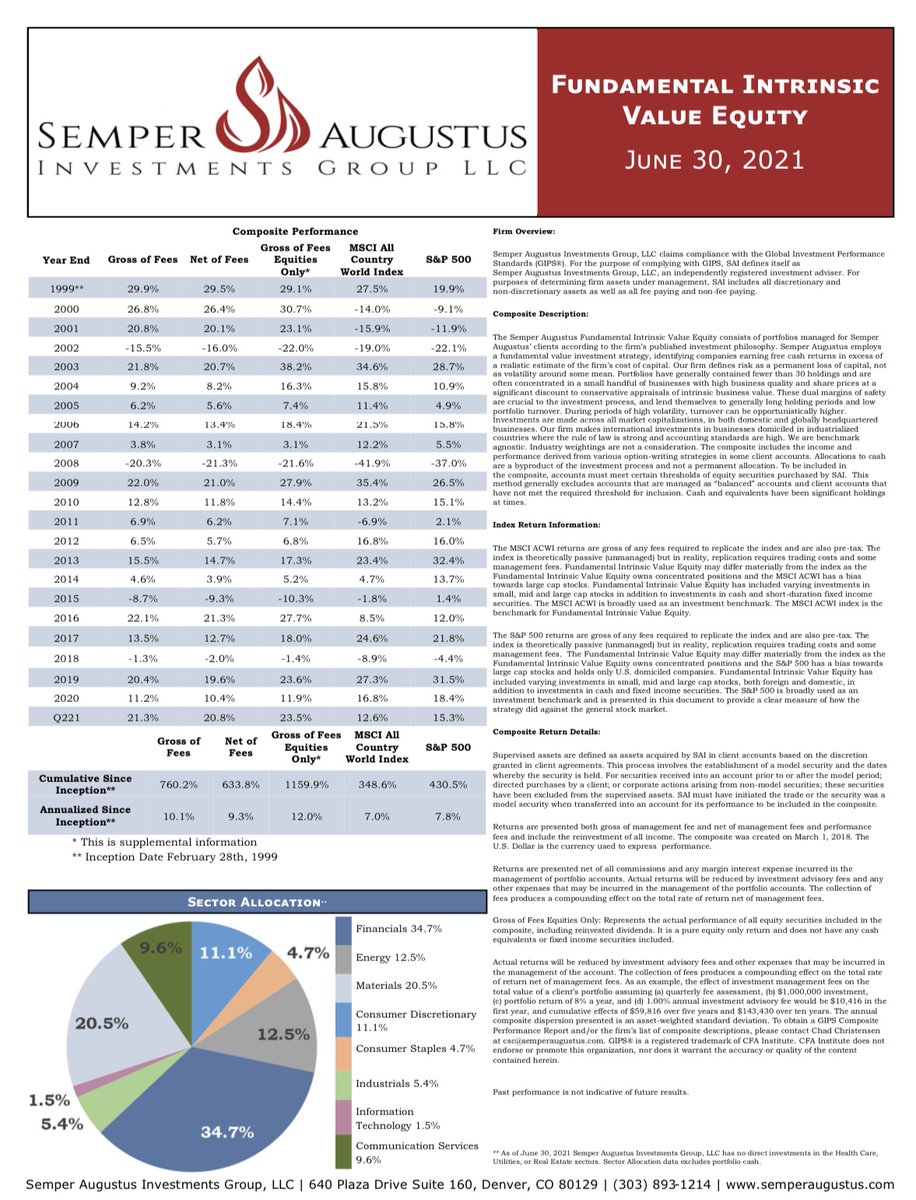
Prominently displayed because we appear to compare favorably to the two benchmark indices. If my portfolio were similarly valued to yours, I might leave it off as well.😉Kidding, of course, but perhaps your shareholders would like seeing what fundamentals actually look like? 18/
While not making a comparison, since my companies generally earn profits, while the majority of yours do not, price to sales may be a better or more useful comparator. I must admit, I don’t recall ever seeing a portfolio trading at 15 times sales. Janus in March 2000? 19/
With mine at a lowly 1.5 times and yours at 10 times that, it would be neat if my stocks produced an immediate, overnight ten-bagger. Alas they won’t (barring a hyperinflation, which is possible), but if they did, we’d have matching valuations! 20/
Instead, and nobody wishes for this (except Michael Burry we now know), if your stocks declined 90% in price, we’d also be price to sales twins! At those prices, I bet I’d even own some of your names. Even though he's short you today, Burry might as well. 21/
My companies grow slower, but are generally durably profitable. I’m not growing 10x in a hurry (it’s taken ~22 years for my stocks to do so) and you are probably not falling 90% anytime soon. To butcher Kipling, 1.5x is 1.5x, and 15x is 15x, and never the twain shall meet. 22/
I guess that despite your portfolio fundamentals being at levels rarely, if ever, seen in investing, and not on your factsheet, if or when Tesla reaches your $3,000 target by 2025, a $3 trillion valuation IGNORING coming dilution, that would be a 4.5x gain from today’s price. 23/
At 10% of your portfolio, Tesla alone will provide a 45% portfolio gain, 9% annual, if it hits $3,000 in 2025. Everything else can just be flat! I might take a 9% annual gain from here to 2025 if it were guaranteed. The overall stock market is valued to produce less. Yours? 24/
Meanwhile, I’m eagerly watching the state insurance commissions around the country to see Tesla approved as an insurance underwriter. I’m sure that’s coming anytime, getting them to your $23 billion in projected 2025 revenues and $60 billion valuation (larger than $PGR)? 25/
Couldn’t help but notice NHTSA's Autopilot investigation. While probably not good optics seeing Tesla’s slamming into emergency vehicles, we’ll have robotaxis on the road, probably in 2 weeks as ol’ Elon likes to say, and get those annual robo revs up to your $327B bull case? 26/
One final thing. I enjoyed reading your thread in response to Burry’s disclosed big short of your ETF. It's well-written and reasoned. I happen to agree that much of the inflation we are seeing at present is indeed transitory, at least in some places. 27/
You had previously Tweeted that market cap to GDP had approached “two to four times current levels” in the late 1800s. Have you seen that the “Buffett Indicator,” where market cap to GDP is now above 200%, is yet at another all-time record? 28/
You happen to have been completely wrong about the measure in the late 1800s, when as an agrarian economy, market cap never exceeded 50% of GDP. It did reach a peak in 1929 at 89%. That was not a good moment to prospectively own stocks and the deflation that came was no fun. 29/
At the midpoint of your range, call it 5x GDP, YOU WERE OFF BY A FACTOR OF 10. Suppose instead of $3,000 per share in 2025 Tesla “only” trades at $300. That would be another 10x factor miss. At $300, you still get to a market cap of roughly $300 billion and 10 times Toyota. 30/
On a run rate of 2021 revenues at Tesla approaching $45 billion, a $300 billion valuation is 6.7x revenues, much slimmer than your portfolio’s 15x at present. If Tesla doubles revenues to $90 billion, you are at 3.3 times sales. Most autos trade for less than 1x. 31/
I hope you do read “The Rise and Fall of American Growth” as previously suggested. Much of the “good deflation” you attribute to your companies is nowhere near prior transformational gains in electricity, conditioned air, auto and air travel, indoor plumbing, medicine, etc. 32/
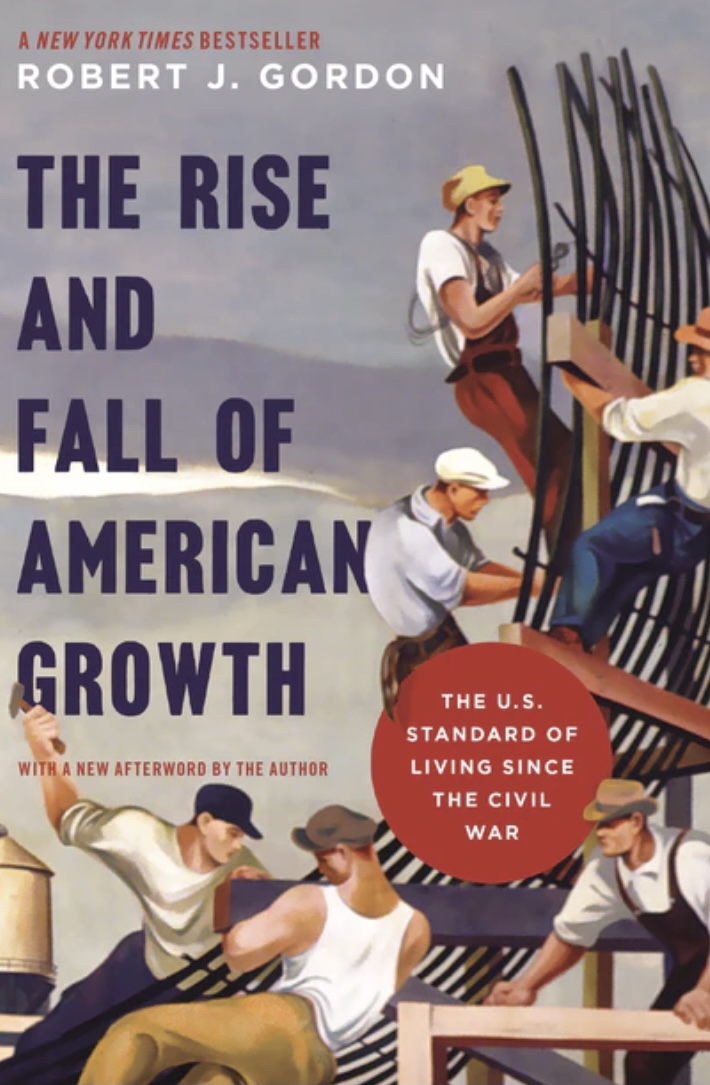
Many argue today’s disruptors are equally transformative. When you read Gordon, you'll see they are wrong. While neat & productive, they are incremental and not dramatically changing living standards and output. BIG moves in reduced hours worked & increased leisure are done. 33/
In fairness, you are to be commended, compounding at more than 30% since 10/31/2014 is remarkable. I won’t speculate as to why Burry is short your portfolio. We know he’s also short Tesla. I’m likewise short Tesla (albeit immaterially), and know why I am. 34
I’m not short your ETF and am cheering for you, except for Tesla. I’m even deep-diving one of your holdings as a potential investment. Gasp. I wouldn’t be surprised that Burry’s short of $ARKK, however, has something to do to with the portfolio fundamentals introduced above. 35/
To your credit, and as an explanation for such apparently extreme fundamental valuations, being up nearly 7-fold in 7 years might have something to do with valuations appearing a mite extended at present, at least to old-school, some would say old-fashioned, value investors. 36/
But look at the bright side, @CathieDWood, since you are now down 6.9% ytd and 11.4% since 6/30, no doubt the decline in prices has improved your portfolio fundamentals! Instead of trading at 15x sales, you must be closer to 13x today. Progress! I'd wager Burry is happy for that.
• • •
Missing some Tweet in this thread? You can try to
force a refresh