Some figures from Chapter 1 of the new IPCC AR6 physical climate science report: ipcc.ch/report/ar6/wg1…

1/ Baselines and reference periods. Ever been confused about different climate baselines? Figures 1.11 and 1.12 may help, along with the discussion in Section 1.4.1.
2/ Climate variability. Short term fluctuations in the climate can temporarily obscure or enhance longer term trends. The size of the fluctuations depends on the variable of interest and spatial scale.

Figure 1.13 and Section 1.4.2 may help explain this.
3/ Emergence. Both the rate of change & the size of climate fluctuations matter for how climate change is experienced. The tropics tends to warm less but has smaller variations so has a larger 'signal-to-noise' ratio; the change is more apparent.
See Figure 1.14 & Section 1.4.2.
4/ Possible futures. Running from 1750 to 2100, an extended set of 'warming stripes' shows how global temperatures have already changed, and are projected to change under different emission scenarios, with the uncertainty range shown. See Figure 1.25 & Section 1.6.1 for details.
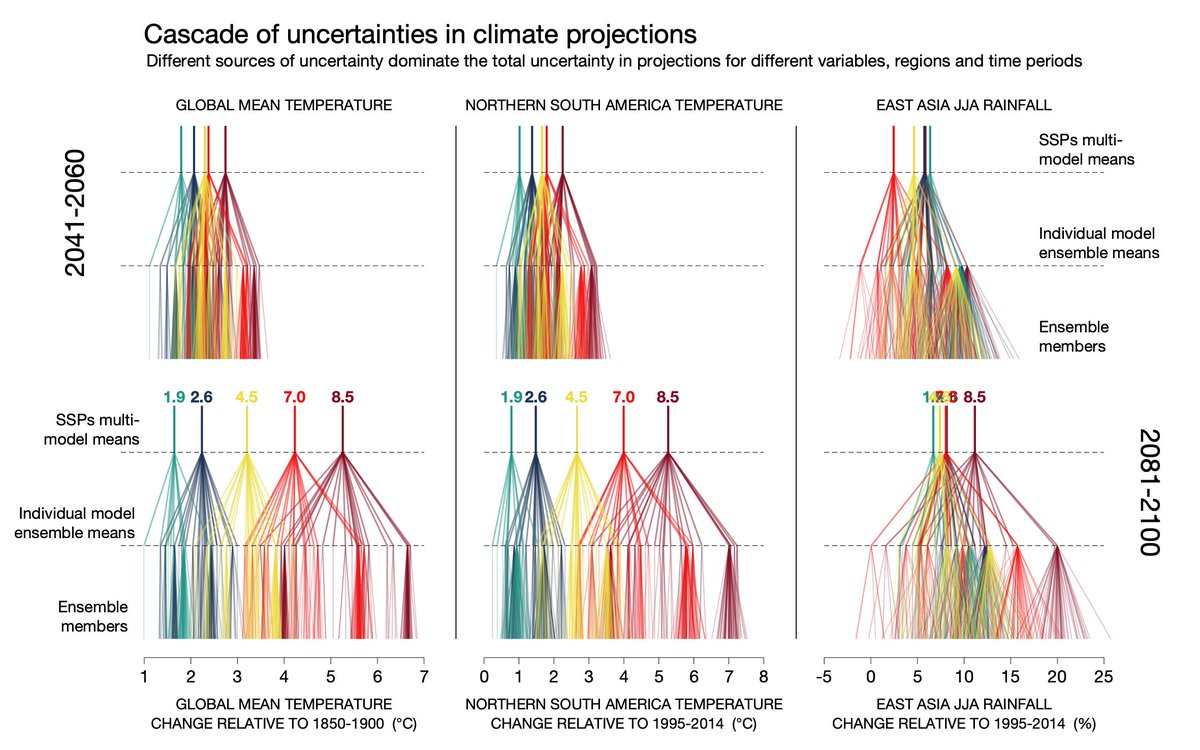
5/ Sources of uncertainty. A complex figure highlights the size of different components of uncertainty in future projections of temperature & rainfall, i.e. choice of scenario, which climate model is used, and internal climate variations. Details in Figure 1.15 & Section 1.4.3.
6/ Low-likelihood high impact outcomes. A new focus for AR6 highlights the risks that would occur if warming was outside the expected likely ranges. These outcomes are unlikely but plausible and need to be considered in risk assessments. Described in Figure 1.16 & Section 1.4.4.
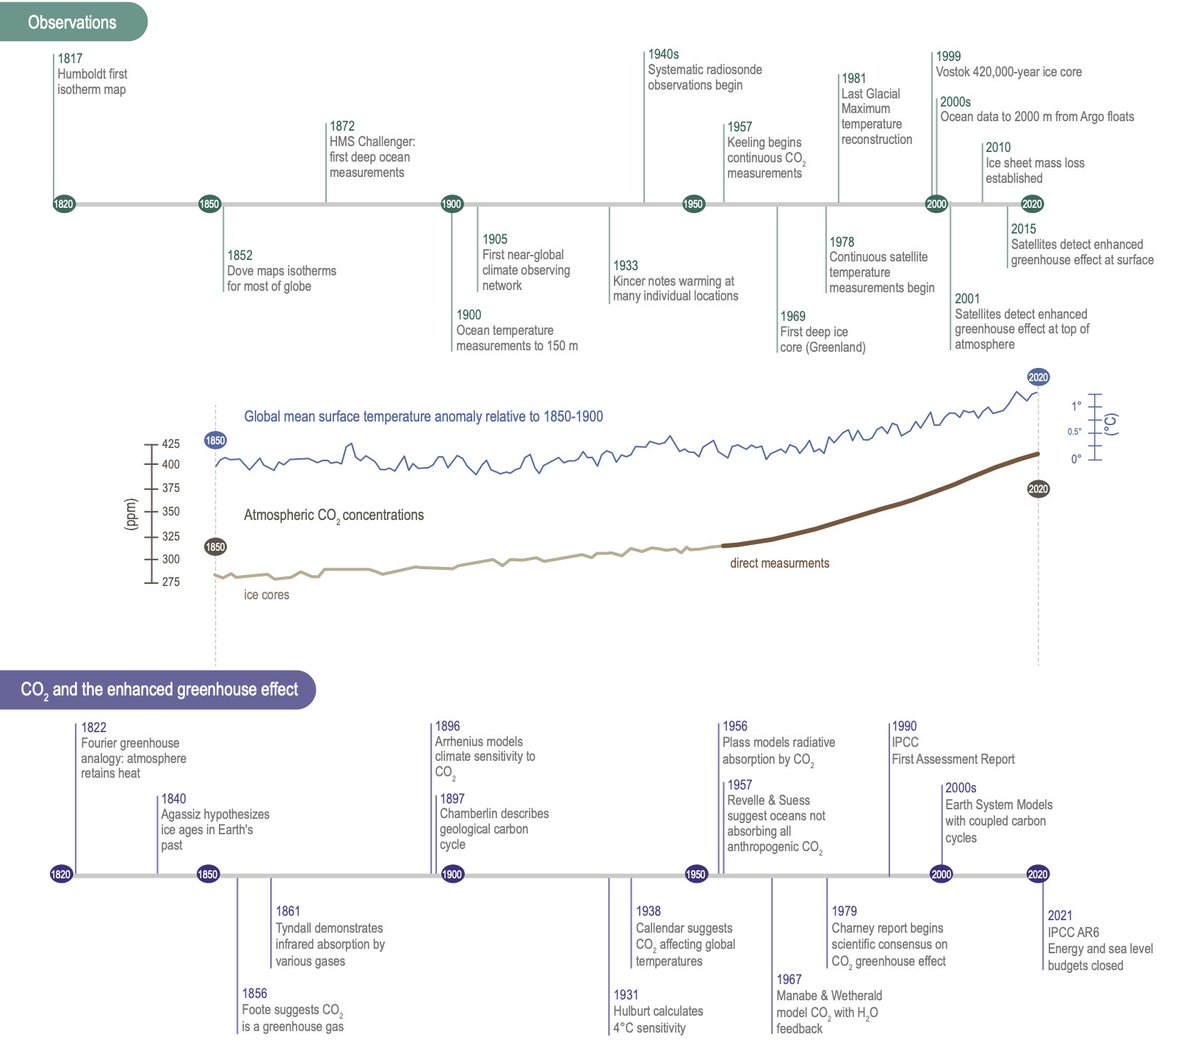
7/ Milestones in climate science. A timeline of how climate science has advanced since the early 1800s. Section 1.3 describes this long history of improving understanding and Figure 1.6 gives some key developments.
8/ The first attribution of global warming. One key milestone is the 1938 study by @GuyCallendar - the first estimate of variations in global temperature & the effect of observed increases in CO₂. Figure 1.8 also compares his global temperature variations with modern estimates.
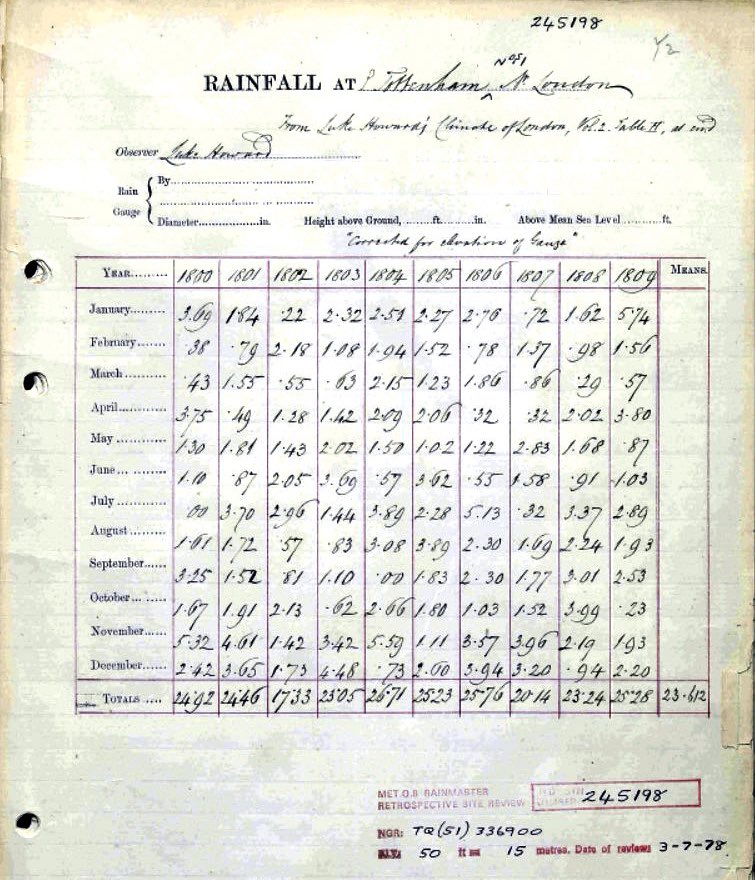
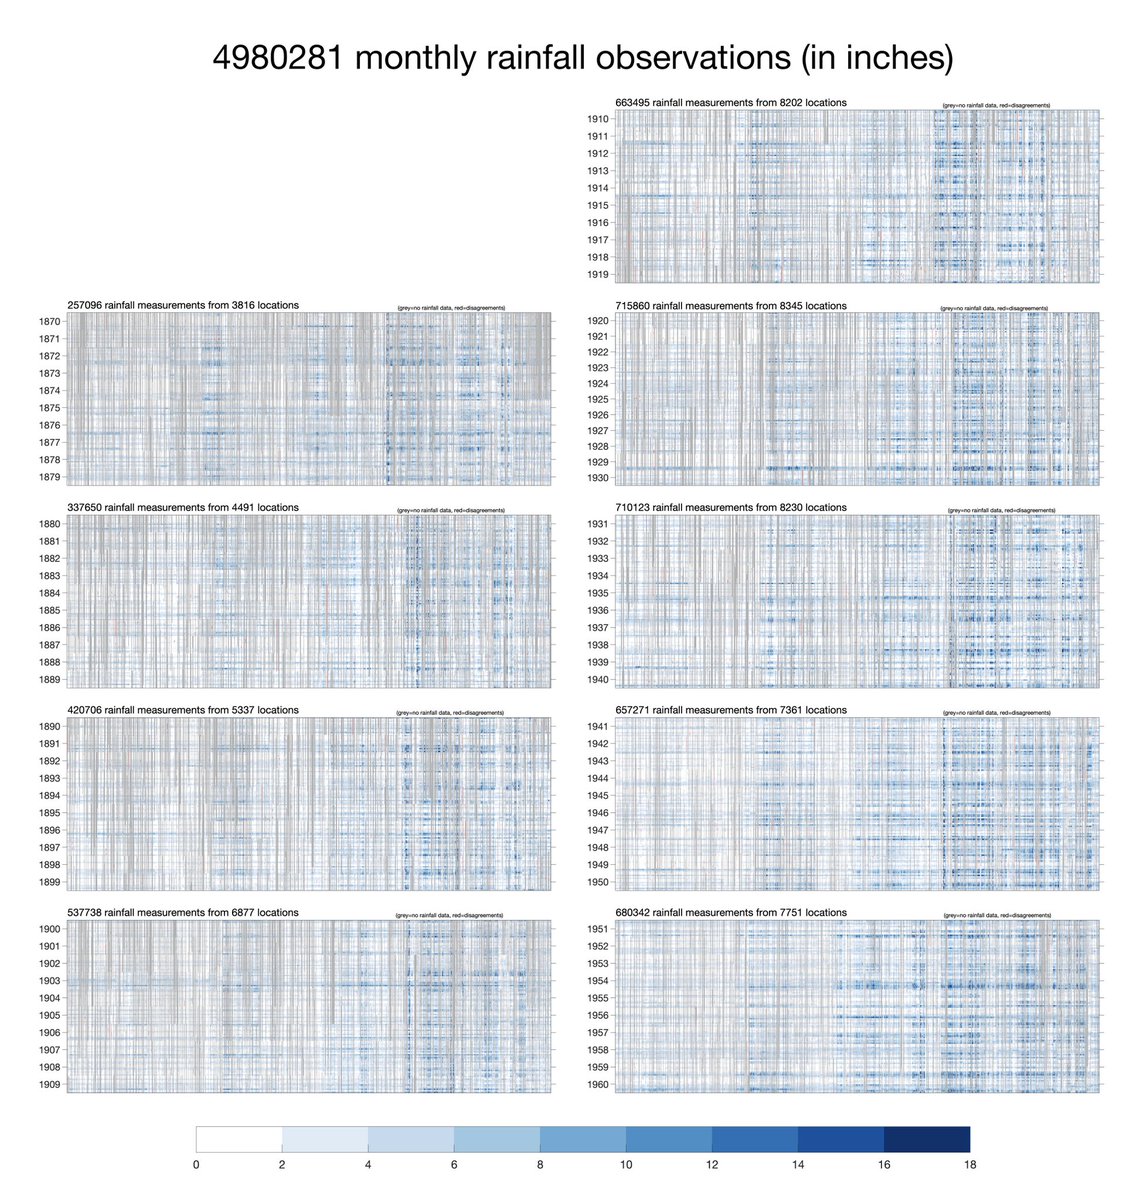
9/ Availability of observations and paleodata. We have varying amounts of instrumental measurements for many different parts of the climate system for decades or centuries, and proxy information for millennia and beyond. Figure 1.7 & Sections 1.3.1 and 1.3.2 have the details.
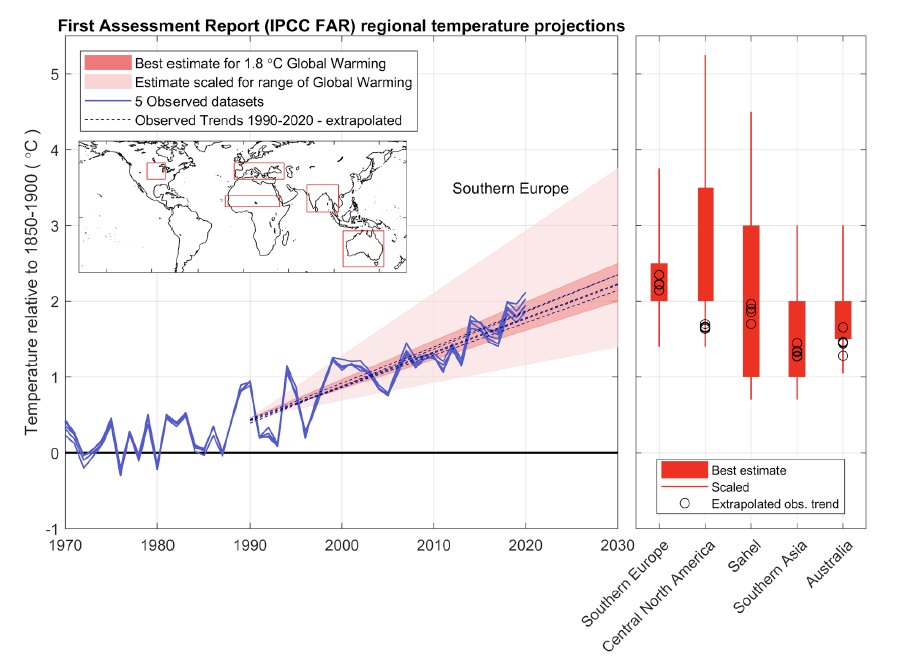
10/ Performance of past projections. We have made projections of future climate for decades & can now test those projections against what subsequently happened, both globally & regionally. The agreement is striking. Figures 1.9 & 1.10 and Section 1.3.6 discuss the issues.
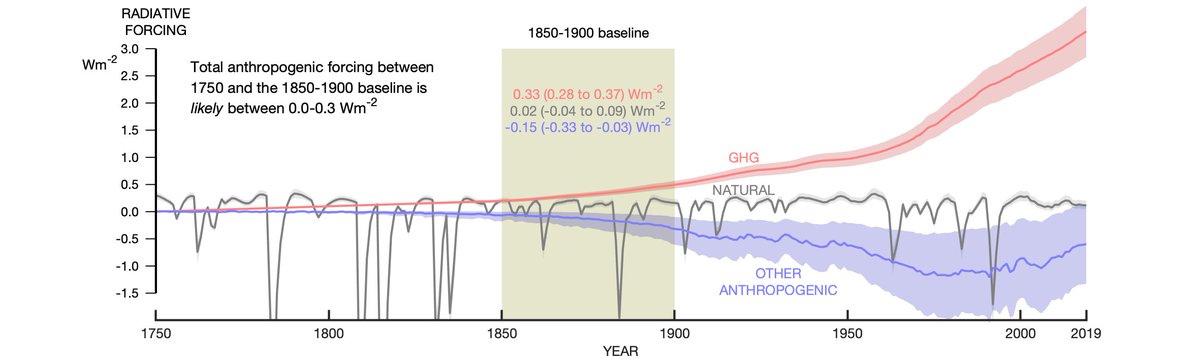
11/ Changes in climate before 1850. Cross-Chapter Box 1.2 discusses the natural & human factors which influenced the climate since 1750. Humans likely caused a radiative forcing of 0.0-0.3W/m² before the approximate pre-industrial global temperature baseline (1850-1900).
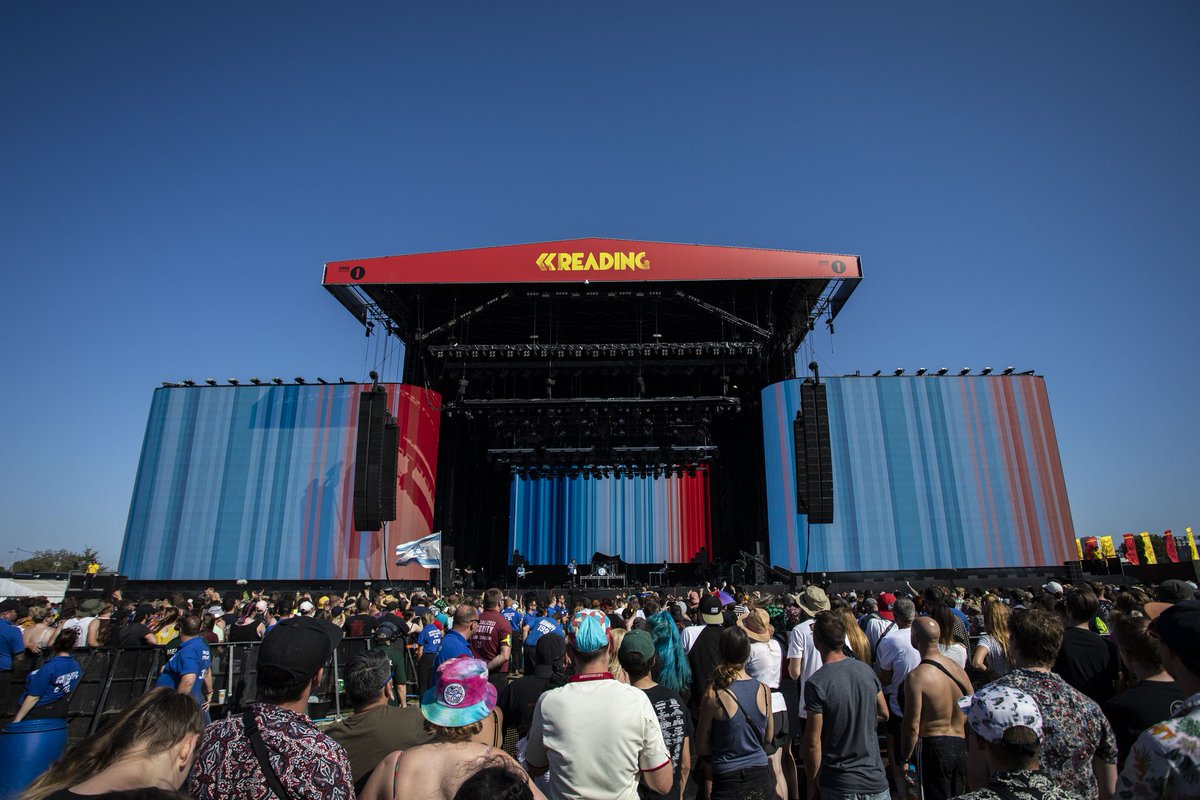
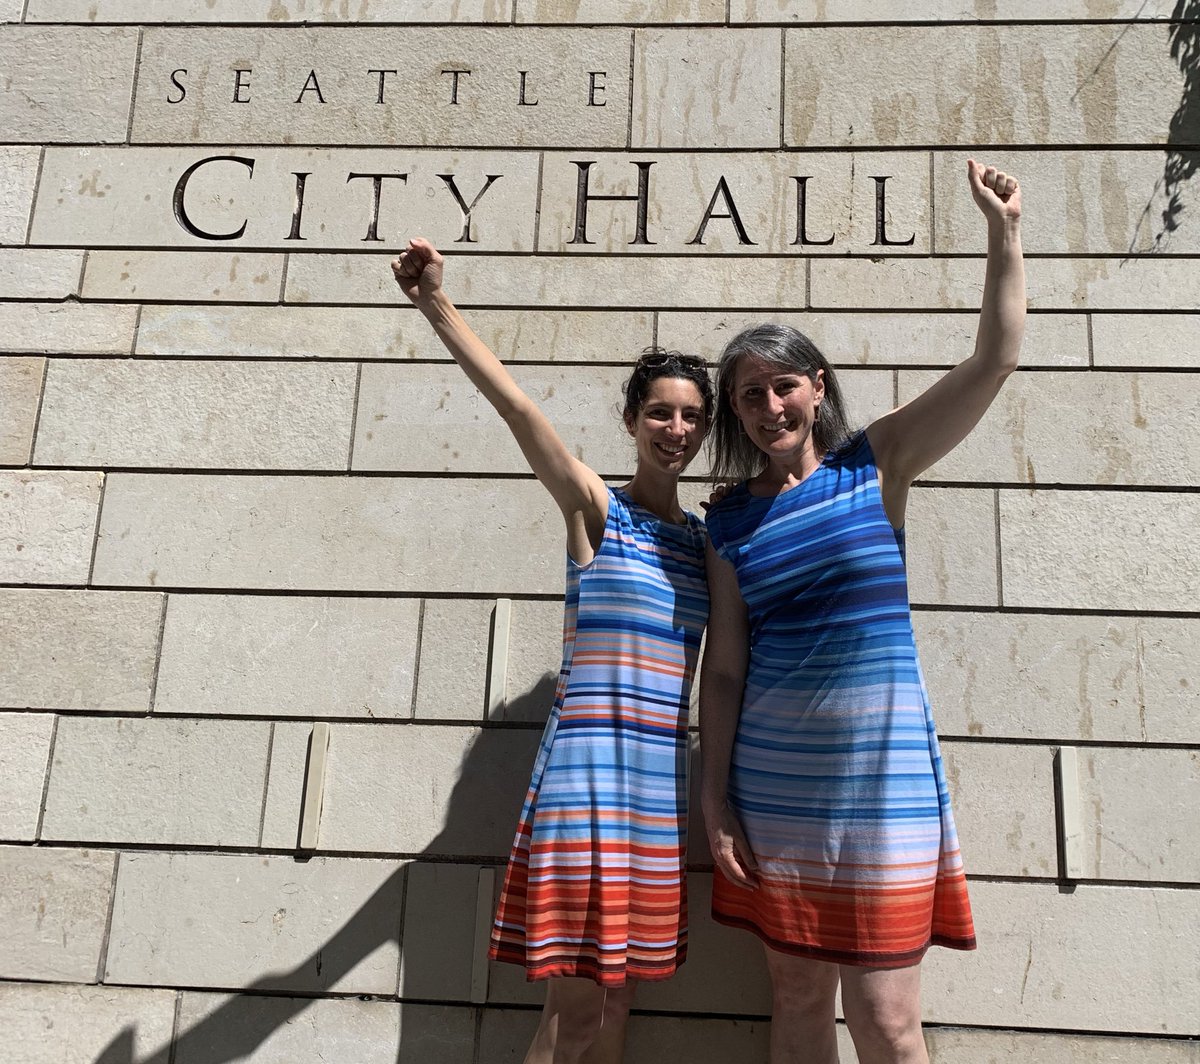
12/ State of the climate. A range of 'climate stripes' highlight changes across every component of the climate system. Figure 1.4 and Section 1.2.1 discuss the changes observed.
13/ Different types of climate model ensemble. A schematic in Figure 1.21 highlights the different ways that climate models are used to produce an ensemble. Section 1.5.4 discusses the details.
These and other figures in Chapter 1 were designed to be widely useful and are thanks to an amazing author team, including: @Maisa_Rojas, @bjornhs, @AVastMachine, @coralsncaves, @ADNiang2201, @meinshausen, @PandoraKHope et al, with contributors: @hausfath, @ClimateGrose, @coxypm.
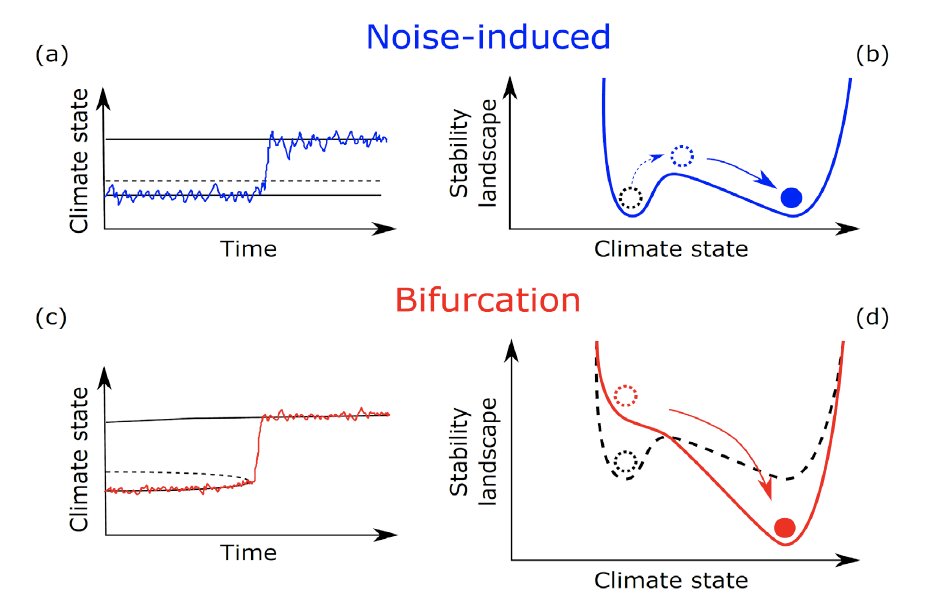
14/ Tipping points. Section 1.4.4 introduces the concepts of tipping points (Figure 1.17), abrupt changes, low-likelihood outcomes (Figure 1.16), storylines and surprises. Some of these are new for the IPCC and are used throughout AR6.

• • •

Missing some Tweet in this thread? You can try to force a refresh
 

Keep Current with Ed Hawkins

Ed Hawkins Profile picture

Stay in touch and get notified when new unrolls are available from this author!

Read all threads

This Thread may be Removed Anytime!

PDF

Twitter may remove this content at anytime! Save it as PDF for later use!

Try unrolling a thread yourself!

how to unroll video
  1. Follow @ThreadReaderApp to mention us!

  2. From a Twitter thread mention us with a keyword "unroll"
@threadreaderapp unroll

Practice here first or read more on our help page!

More from @ed_hawkins

16 Jul
Dear @BBCNews: this phrase, used in several recent articles, is not a fair representation of the science on extremes.

”Experts say that climate change is expected to increase the frequency of extreme weather events, but linking any single event to global warming is complicated.”
How about “Experts say that climate change is already increasing the frequency of extreme weather events, and many single events have been shown to have been made worse by global warming.” instead?
Perhaps @BBCAmos, @MattMcGrathBBC, @RHarrabin or @davidshukmanbbc could chat (again?) with the news team? The science has moved on and it would be great to see that reflected in the news coverage of extreme weather events, rather than the current inaccurate stock phrase.
Read 4 tweets
21 Jun
How have the #ShowYourStripes graphics been used to start conversations about climate change in the past? (1/n)

Worn by Senators during the 2020 State of the Union address in the US: bbc.co.uk/news/av/scienc…
Displayed by @ENTERSHIKARI during Reading Festival to thousands of music fans. The lead singer @RouReynolds discusses what they mean and why they are important during the performance, stimulating new conversations. (2/n)
Made into dress form by @huprice, and worn when visiting policymakers to discuss climate change. (3/n)
Read 6 tweets
21 Jun
The planet is warming due to human activities, primarily burning fossil fuels & deforestation.

Climate change is happening here & now, and is already affecting everyone. The consequences will get worse for each bit of further warming.

#ShowYourStripes ShowYourStripes.info
Today is #ShowYourStripes day, when people around the world share how the climate is changing where they live. These graphics start conversations about our changing climate and what we can do about it.

Here are my stripes. Download yours: ShowYourStripes.info
TV meteorologists around the world are joining #ShowYourStripes to discuss how climate change is affecting their countries.

Here is @mollenweather showing the stripes for Uganda:
Read 9 tweets
13 May
Two years ago there were 65,000 sheets of paper containing hand-written measurements of rainfall taken all across the UK & Ireland before 1960. Virtually all of the 5.28 million observations on these sheets were unavailable to climate scientists as they had never been digitised.
Thanks to @metoffice archives, these sheets were scanned & made openly available, but how could the observations be extracted?

The answer? Ask for help: bbc.co.uk/news/science-e…

16,000 volunteers stepped forward during the first UK COVID lockdown to transcribe every observation.
After a year of continued effort by a small team of volunteers we can now release the data!

Rainfall Rescue dataset v1.0.0:
doi.org/10.5281/zenodo…

3.3 million observations have been quality controlled, and combined into time series from 8485 rain gauges from 6095 locations.
Read 7 tweets
9 Apr 20
The #RainfallRescue volunteers are now digitising the very earliest UK rainfall data, from the 1860s and earlier.

Some stretch back to 1677, or they might stumble across rainfall records taken by Luke Howard.

Will they finish the job today or tomorrow? rainfallrescue.org
5 million observations rescued so far for the 1870s to 1950s. #RainfallRescue
Day 16 of #RainfallRescue.

The 15,607 volunteers will today finish transcribing the last of the 65,000 sheets of 10-year monthly rainfall amounts for the UK, spanning 1677 to 1960.

Truly amazing to see 5+ million measurements rescued from paper to digital in such a short time.
Read 5 tweets
20 Jan 20
Earth's climate has changed before for reasons nothing to do with human activity. Changes in the position of the continents, the sun's output, the number of volcanic eruptions, and the Earth's orbit have all influenced our planet's climate. Climate scientists study these reasons.
We know that none of those reasons can explain the warming measured since 1850. We also know that an increase in levels of greenhouse gases in the atmosphere will warm the planet, just as we've observed. It is our emissions of CO₂ that dominates recent warming trends.
Read 8 tweets

Did Thread Reader help you today?

Support us! We are indie developers!


This site is made by just two indie developers on a laptop doing marketing, support and development! Read more about the story.

Become a Premium Member ($3/month or $30/year) and get exclusive features!

Become Premium

Too expensive? Make a small donation by buying us coffee ($5) or help with server cost ($10)

Donate via Paypal Become our Patreon

Thank you for your support!

Follow Us on Twitter!

:(