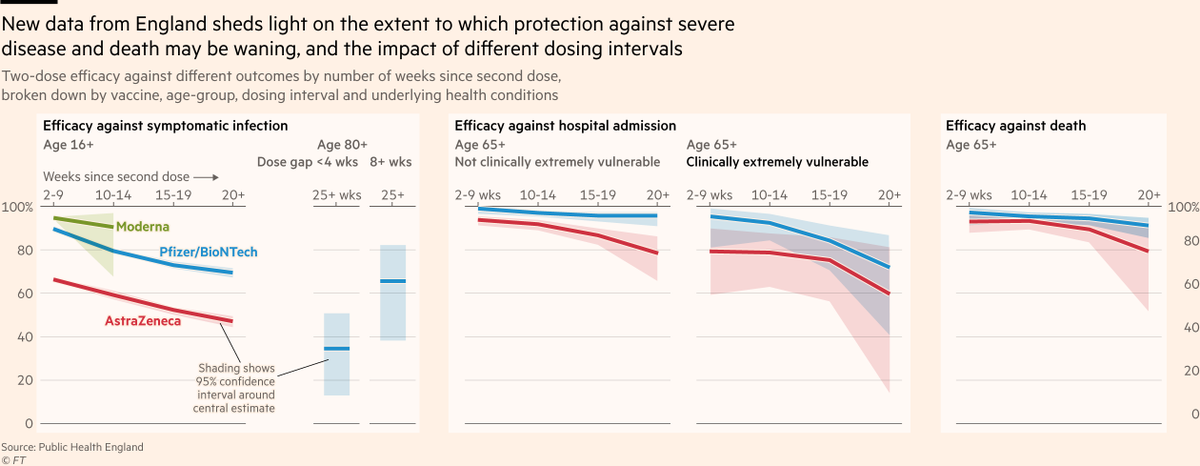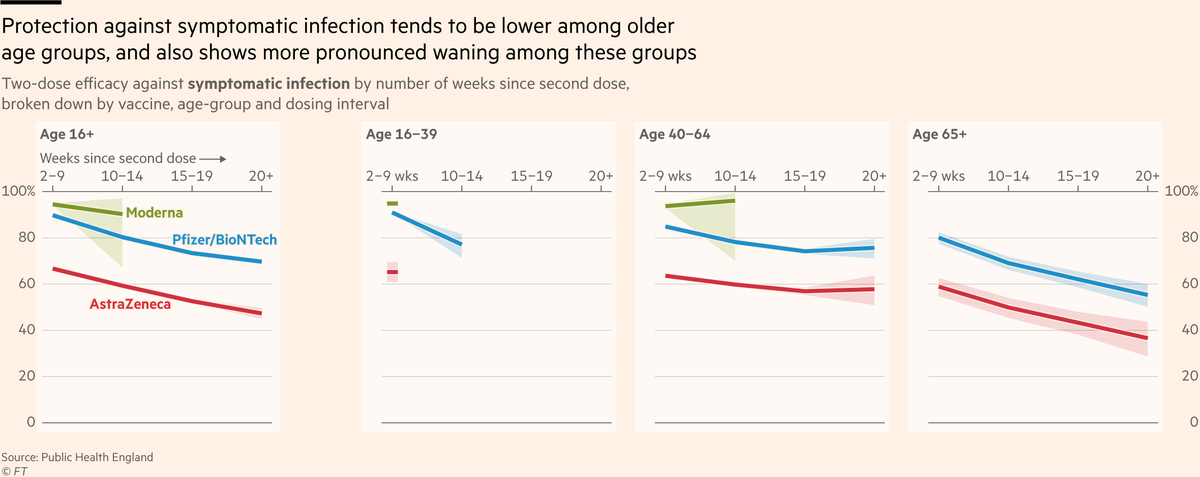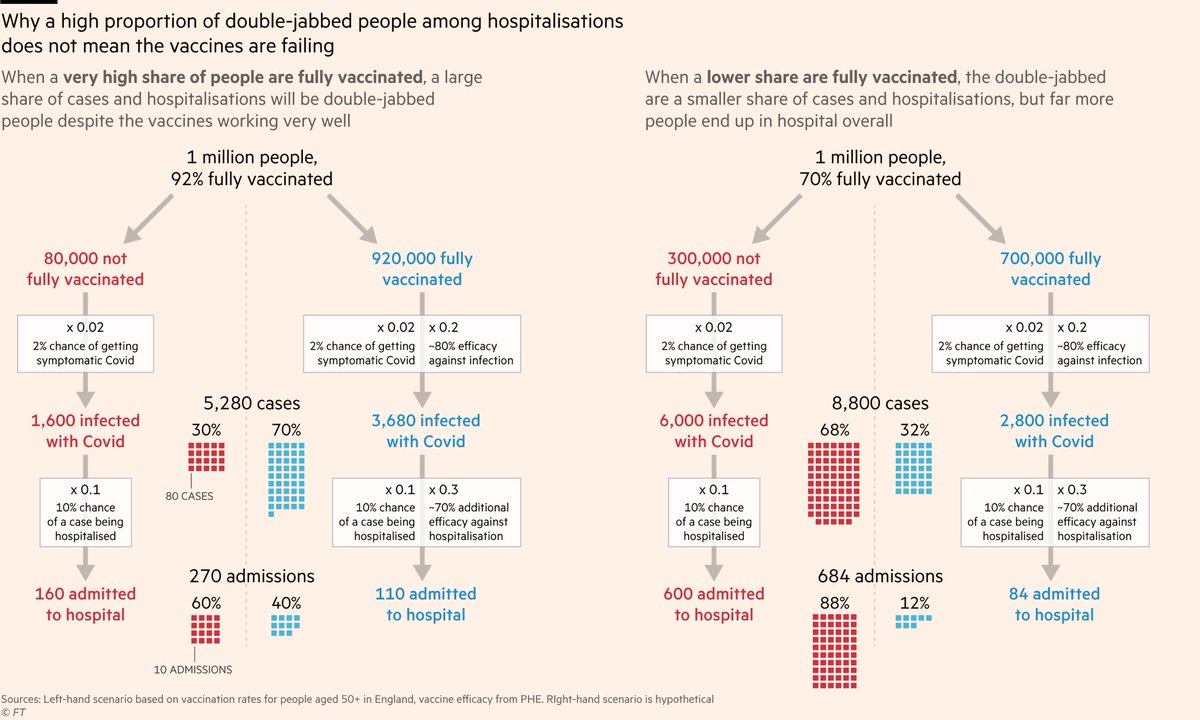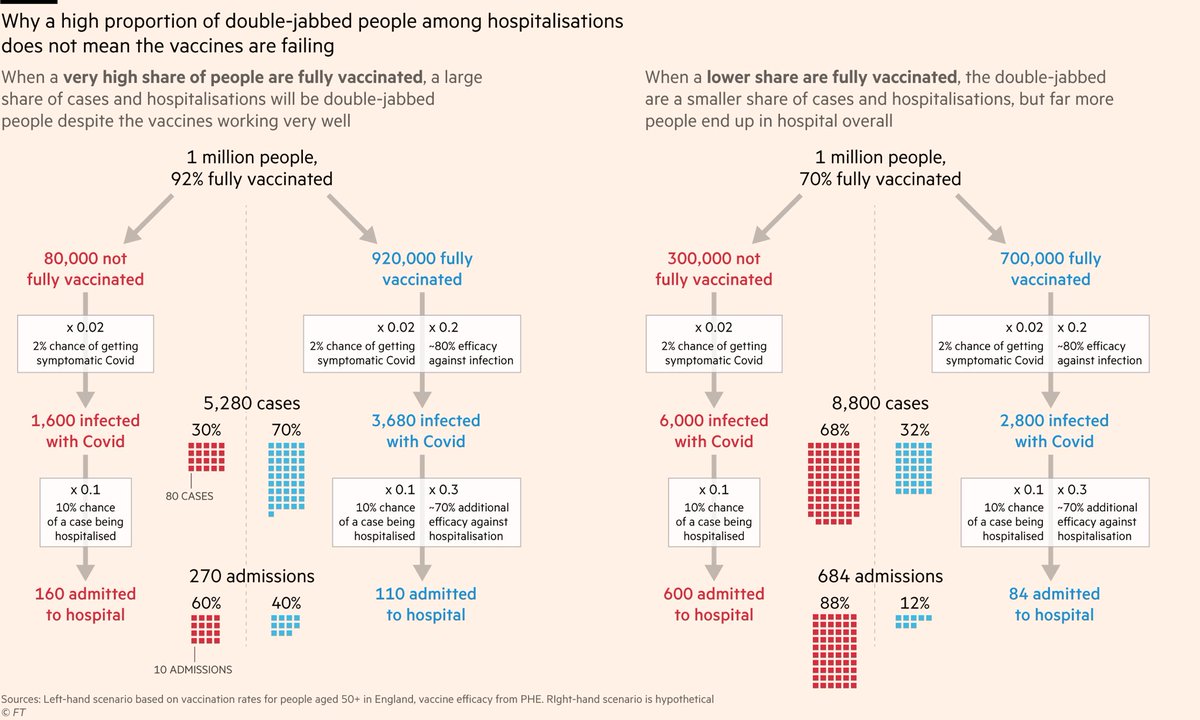
NEW: in the last couple of weeks there have a *lot* of new studies out assessing vaccine efficacy, many of which have touched on the question of waning immunity.
Unsurprisingly, these have prompted a *lot* of questions.
Time for a thread to summarise what we do and don’t know:
Unsurprisingly, these have prompted a *lot* of questions.
Time for a thread to summarise what we do and don’t know:
Let’s start with last week’s Oxford paper, the most significant study to date on waning immunity to Covid.
The researchers found signs that vaccine efficacy against symptomatic infection erodes over time, and that waning may occur faster in some vaccines than others.
The researchers found signs that vaccine efficacy against symptomatic infection erodes over time, and that waning may occur faster in some vaccines than others.

Unsurprisingly, this prompted a lot of questions.
Could it just be that the first people to be vaccinated were older, and perhaps more vulnerable to waning?
Nope. The study controlled for age.
Could it just be that the first people to be vaccinated were older, and perhaps more vulnerable to waning?
Nope. The study controlled for age.
Could it be that, within each age group, the first to be vaccinated were more likely to have underlying conditions? Perhaps they were healthcare workers who are more exposed to the virus?
Nope. The study controlled for both of those. And a huge list of other possible confounders
Nope. The study controlled for both of those. And a huge list of other possible confounders

What if the first to be jabbed have been taking more risks? Not impossible of course, but unlikely. Are older and more vulnerable people really likely to be taking more risks than people who chose not get the jab (quite a risky choice)?
I would say no. But more on this later...
I would say no. But more on this later...
So protection against infection really *does* seem to be falling over time.
But there are still multiple possible interpretations here: is protection falling because of waning immunity, or could other dynamics be at play?
But there are still multiple possible interpretations here: is protection falling because of waning immunity, or could other dynamics be at play?
For example, do vaccines work per person, or per exposure?
e.g if a vaccine is 90% effective at stopping symptomatic infection, but you get exposed on multiple occasions as time passes, is your relative chance of infection fixed at 1-0.9 = 10%), or 1-(0.9*0.9*0.9...) = >20%
e.g if a vaccine is 90% effective at stopping symptomatic infection, but you get exposed on multiple occasions as time passes, is your relative chance of infection fixed at 1-0.9 = 10%), or 1-(0.9*0.9*0.9...) = >20%
If it’s the latter, then it’s possible that even with no waning of immunity, we could observe waning efficacy as people get exposed multiple times.
Or, as @erlichya puts it:
Or, as @erlichya puts it:

But while that may explain part of what we’re seeing, it’s unlikely to account for all of it:
First, that mechanism can’t explain why we’d see one vaccine’s efficacy fall faster than another’s, whereas immunology itself does offer some clues:
First, that mechanism can’t explain why we’d see one vaccine’s efficacy fall faster than another’s, whereas immunology itself does offer some clues:

And second, the phenomenon of waning immunity against infection, as antibody titres decline with time since the vaccine, is exactly what immunologists would expect to happen.
Indeed, @michaelmina_lab was talking about this as early as November
Indeed, @michaelmina_lab was talking about this as early as November
https://twitter.com/michaelmina_lab/status/1328356167031074818
As with so many aspects of Covid, in reality it’s probably a bit of both. Some waning of our antibodies’ ability to fight off infection, and some mathematical erosion of our protection due to rolling the dice again and again as the virus continues to circulate.
But critically, despite signs of waning protection against infection, there are no clear signs yet that our defences are failing when faced with severe disease.
While we see a range of results for infection, for severe disease all bars are clustered near the top of the chart.
While we see a range of results for infection, for severe disease all bars are clustered near the top of the chart.

To be clear, there have been scattered reports of evidence of waning protection against severe disease, but in most cases they have not held water:
Here, @jsm2334 expertly demonstrated how without properly controlling for age, efficacy against severe disease in Israel can appear weak when in fact within each age-group it’s extremely strong covid-datascience.com/post/israeli-d…
Another example from Israel is the share of cases that end up in hospital.
In the UK, this has fallen by about 70% since vaccines were rolled out. In Israel, it’s fallen by only 40%.
So that must mean protection against severe disease in Israel has waned? Well...
In the UK, this has fallen by about 70% since vaccines were rolled out. In Israel, it’s fallen by only 40%.
So that must mean protection against severe disease in Israel has waned? Well...
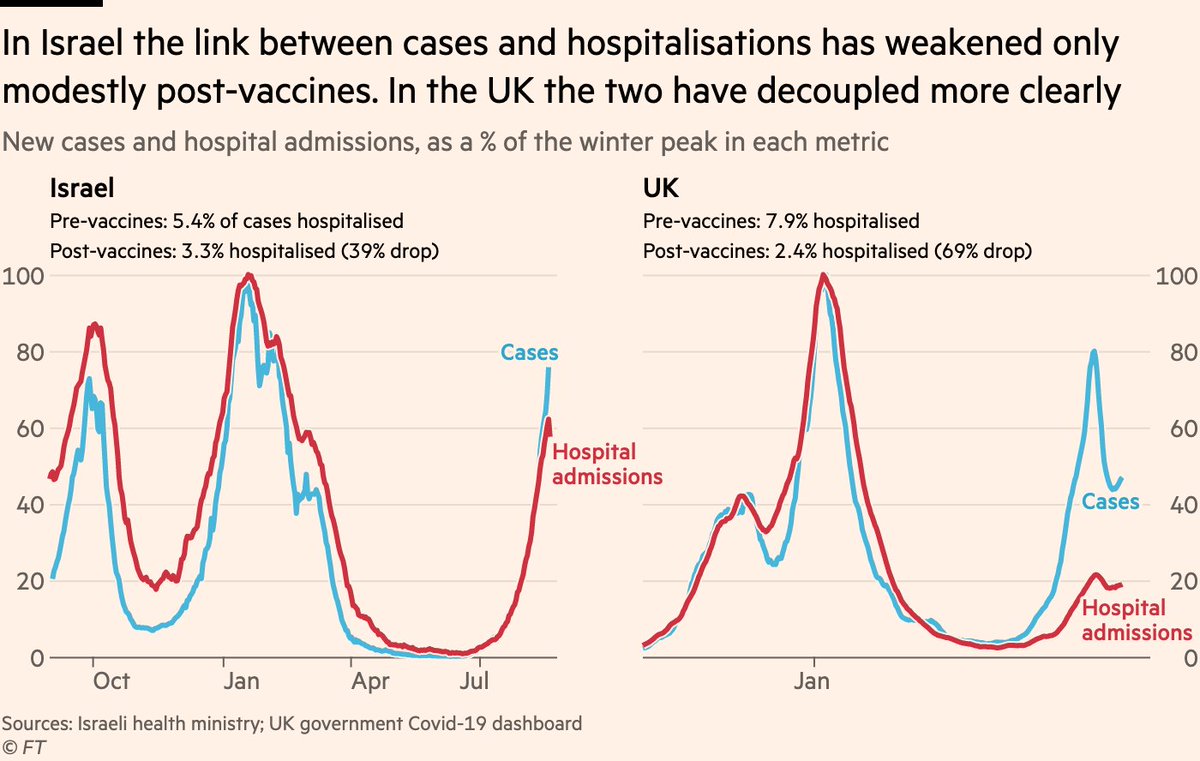
The case-hospitalisation-rate (CHR) is mostly mediated by the age profile of cases. Higher share of cases among elderly? CHR will rise.
Turns out that while vaccines reduced the 60+ share of English cases by ~75%, it fell less in Israel and quickly rebounded as young were jabbed
Turns out that while vaccines reduced the 60+ share of English cases by ~75%, it fell less in Israel and quickly rebounded as young were jabbed

So Israel’s more most decline in CHR seems to be mainly the result of its more modestly shifted case age profile (due to a different vaccination rollout to the UK), not due to cases in any given age group becoming more likely to end up in hospital. This is a relief!
But this in itself prompts a critical question:
If protection against infection wanes, could this indirectly bleed into waning protection against severe disease, even without any waning of the B cell and T cell -mediated immune response that defends against severe disease?
If protection against infection wanes, could this indirectly bleed into waning protection against severe disease, even without any waning of the B cell and T cell -mediated immune response that defends against severe disease?
It boils down to which of the two following mental models best describes how the two parts of the immune response combine:
1) Roll a die (antibodies). If it’s a 6, you get symptoms and roll again (T cells & B cells). If that’s a 6, u get severe disease
Waning immunity means now either 5 *or* 6 on first roll = symptoms. Even tho second roll is still a 1/6 shot, overall risk has gone from 1/36 to 2/36
Waning immunity means now either 5 *or* 6 on first roll = symptoms. Even tho second roll is still a 1/6 shot, overall risk has gone from 1/36 to 2/36
Or is it 2):
You want to prevent a flood. You have a 10 foot brick wall (antibodies), and a 30 foot concrete wall (T and B cells).
Even if your 10 foot wall crumbles, a flood has no more chance of breaching your big concrete wall than it did when the brick wall was intact.
You want to prevent a flood. You have a 10 foot brick wall (antibodies), and a 30 foot concrete wall (T and B cells).
Even if your 10 foot wall crumbles, a flood has no more chance of breaching your big concrete wall than it did when the brick wall was intact.
If it’s 2, we’re in a decent place. Waning immunity might see more vaccinated people develop symptoms than a couple of months back, but very few get properly sick.
If it’s 1, things look less rosy. As more vaxxed people develop symptoms, a steady share of them get properly sick.
If it’s 1, things look less rosy. As more vaxxed people develop symptoms, a steady share of them get properly sick.
As ever, Israel is the canary down the coal-mine.
Waning immunity against infection seems pretty clear there: comparing cases rates between unvaxxed and fully-vaxxed in the spring was comparing night and day. Comparing them three months later was a different story...
Waning immunity against infection seems pretty clear there: comparing cases rates between unvaxxed and fully-vaxxed in the spring was comparing night and day. Comparing them three months later was a different story...

And as cases among fully-vaxxed rose in July, so did rates of severe disease, as a roughly constant share of cases.
That is one point in favour of mental model 1), the dice. But it’s very early days, and the Israeli data is full of potential confounders.
That is one point in favour of mental model 1), the dice. But it’s very early days, and the Israeli data is full of potential confounders.

Final thought for today:
Understandably, talk of waning immunity means lots of chatter about boosters [in rich countries].
There are still dozens of countries with hardly any first and second doses done let alone thirds, and their epidemics are as lethal as they have ever been.
Understandably, talk of waning immunity means lots of chatter about boosters [in rich countries].
There are still dozens of countries with hardly any first and second doses done let alone thirds, and their epidemics are as lethal as they have ever been.

Further reading:
• Last week @hannahkuchler and I wrote a big explainer on waning immunity ft.com/content/496416…
• This morning @MehulAtLarge and I wrote an update from Israel where it’s waning immunity vs boosters ft.com/content/23cdbf…
• Last week @hannahkuchler and I wrote a big explainer on waning immunity ft.com/content/496416…
• This morning @MehulAtLarge and I wrote an update from Israel where it’s waning immunity vs boosters ft.com/content/23cdbf…
Oh, and @mroliverbarnes and I have a story here on the current situation in the UK, explaining why September will bring much tougher tests for our Covid defences than July 19th ever threatened ft.com/content/8a1033…
Oh, and I’m now going on holiday for three weeks
Big thanks to everyone who’s helped me clarify my thinking on lots of concepts here, including: @nataliexdean @deeptabhattacha @JoshBiostats @dylanhmorris @JamesWard73 @ElworthyStone @phl43 @segal_eran @flodebarre @erlichya @mugecevik @andrew_croxford @_lewisy @AaronRichterman
Two brief additions to yesterday's thread on waning immunity, based on frequently asked questions:
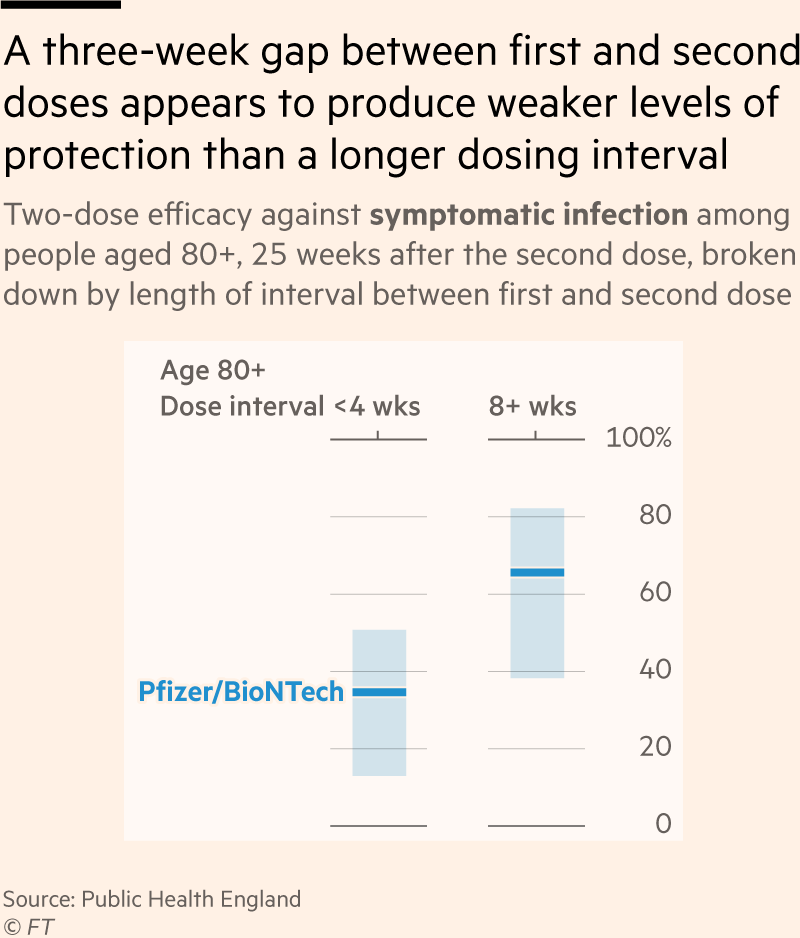
1) Could the severity of Israel's breakthrough wave be driven partly by shorter dosing intervals (3 weeks) than UK (8-12 weeks)?
1) Could the severity of Israel's breakthrough wave be driven partly by shorter dosing intervals (3 weeks) than UK (8-12 weeks)?
Its definitely possible, but no hard evidence for this yet. Oxford study found no difference in efficacy when split by +/- 9 weeks, but most <9wk gaps in UK were more like 8 wks than 3, so can only us so much.
And 2) what do we know about immunity from prior infection?
• Immunity against Delta holds up best among people who've been fully vaxxed *and* infected (duh)
• So far studies on how long infection-only immunity lasts haven't looked at Delta, so need more data here
• Immunity against Delta holds up best among people who've been fully vaxxed *and* infected (duh)
• So far studies on how long infection-only immunity lasts haven't looked at Delta, so need more data here
And here's the full Oxford study from @kb_pouwels and co: ndm.ox.ac.uk/files/coronavi…
• • •
Missing some Tweet in this thread? You can try to
force a refresh


