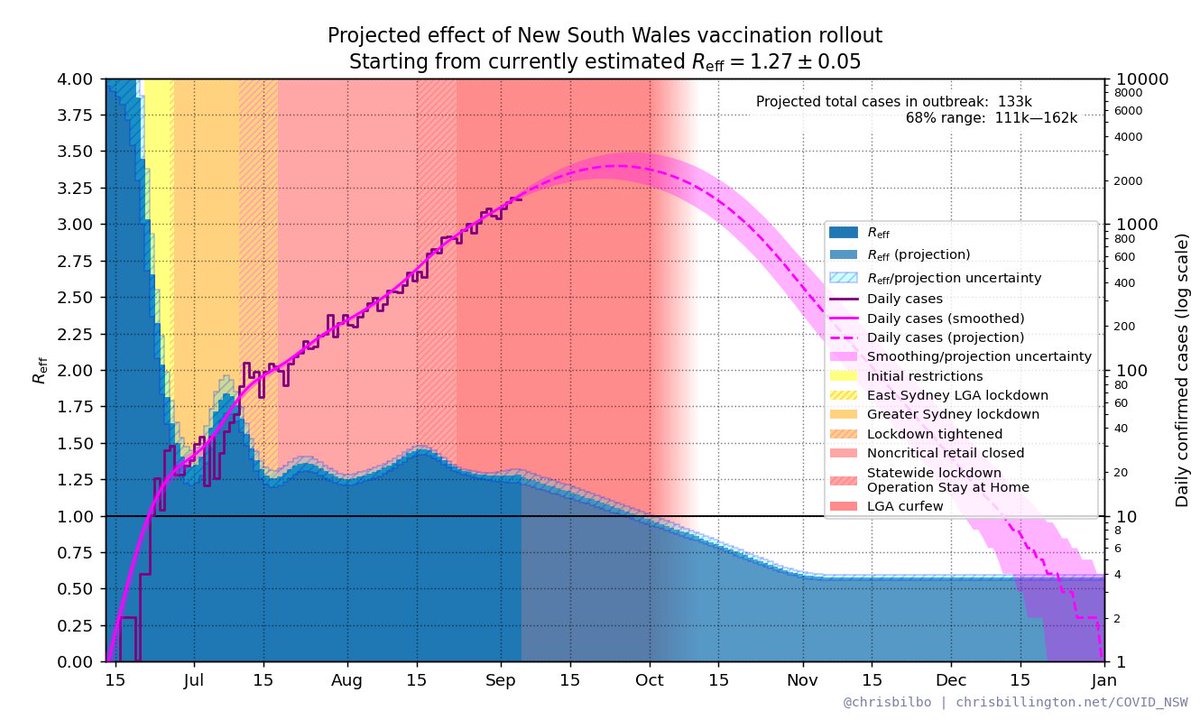
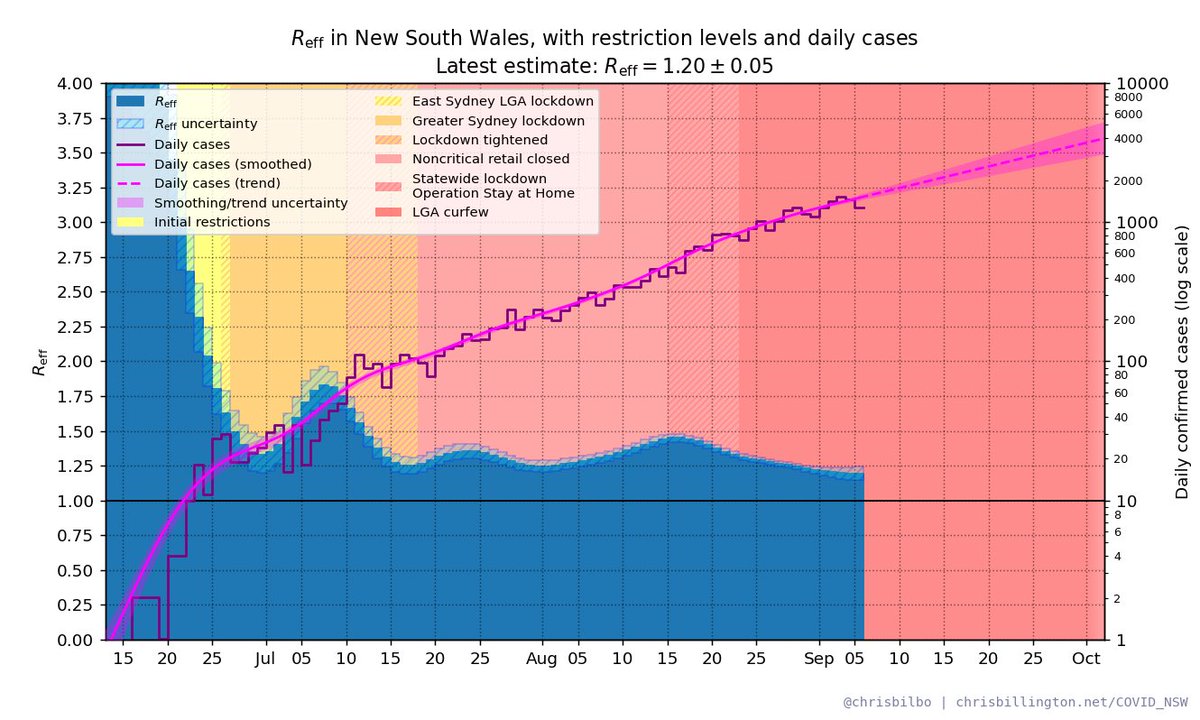
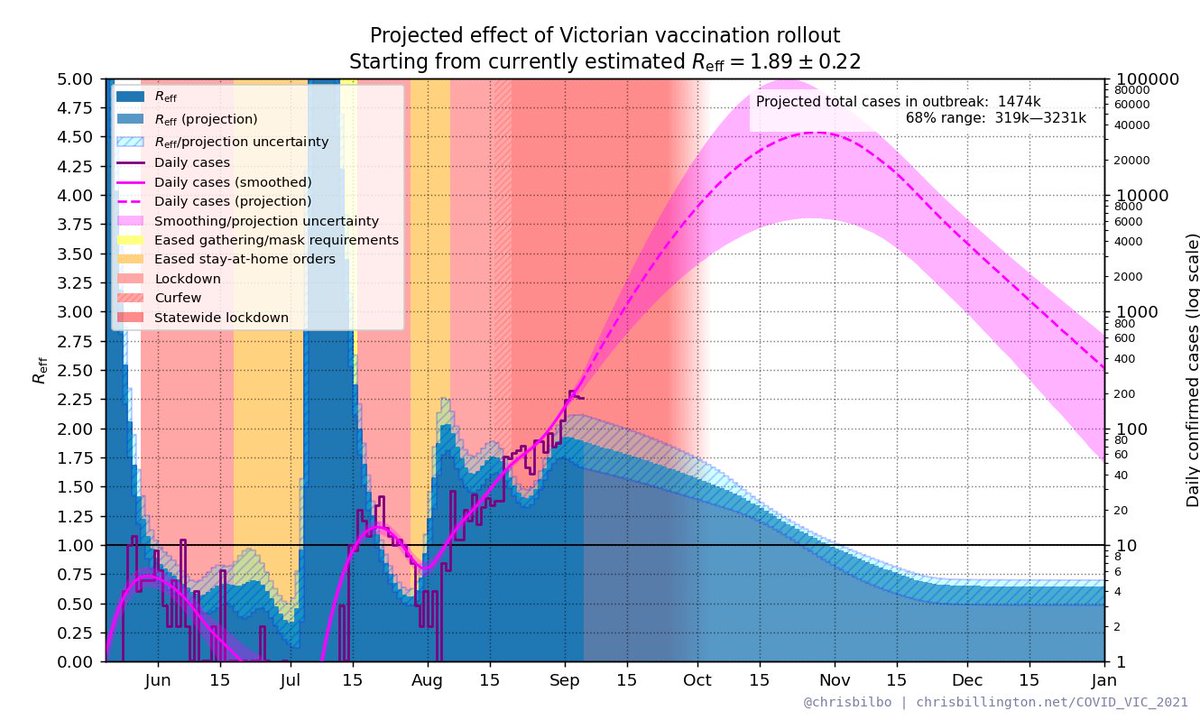
NSW R_eff as of September 5th with daily cases and restrictions. Latest estimate: R_eff = 1.27 ± 0.05

Plus projected effect of vaccination rollout.

(Cases shown on a log scale)

More info chrisbillington.net/COVID_NSW.html

#covid19nsw #covidsydney
NSW R_eff as of September 5th with daily cases and restrictions. Latest estimate: R_eff = 1.27 ± 0.05

Plus projected effect of vaccination rollout.

(Cases shown on a log scale)

More info chrisbillington.net/COVID_NSW.html

#covid19nsw #covidsydney
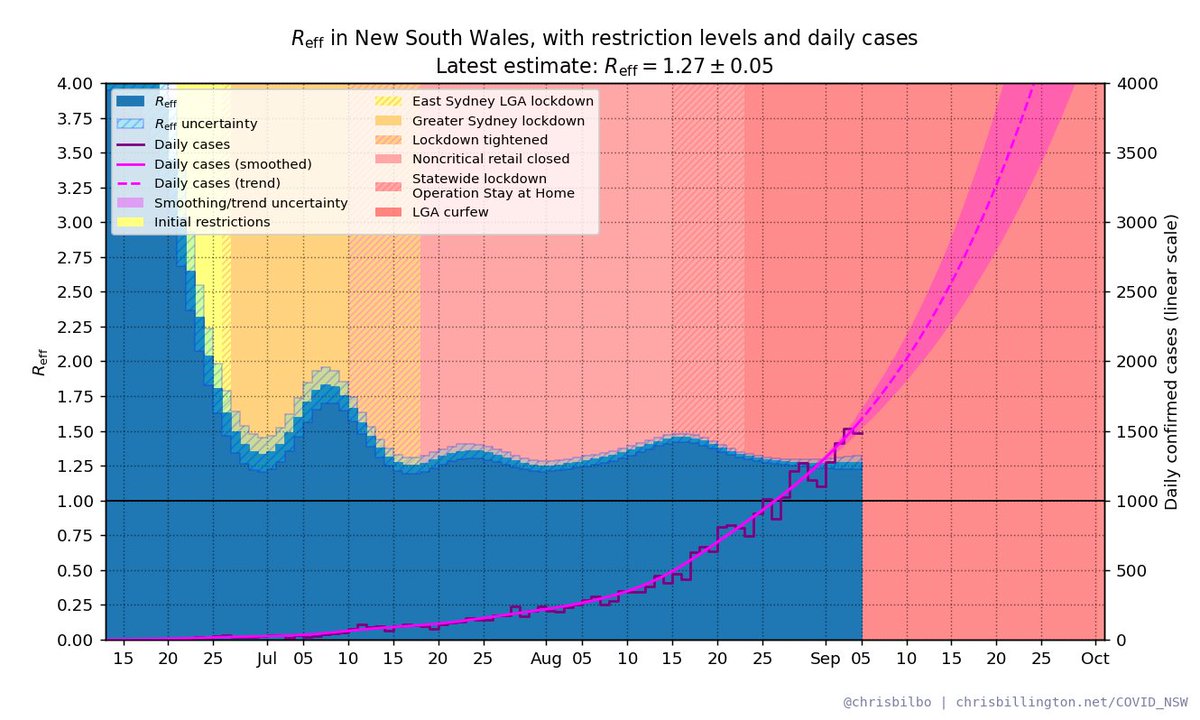
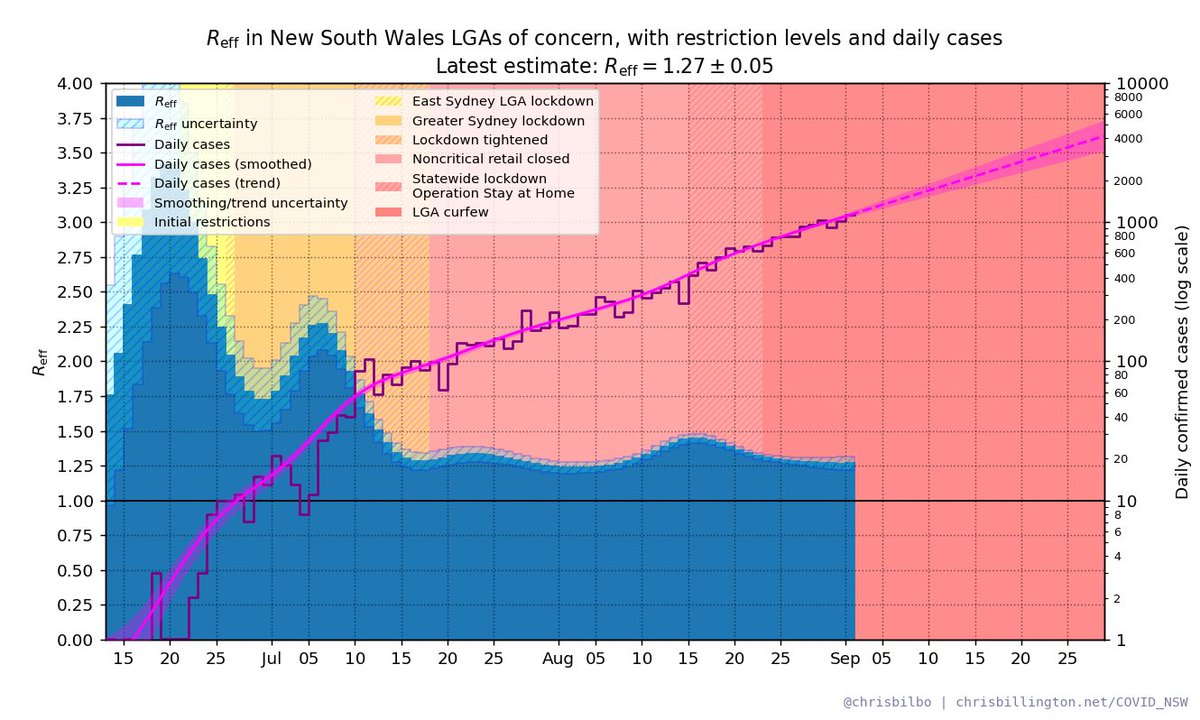
R_eff in LGAs of concern* vs the rest of NSW (*all of Penrith included):

LGAs of concern: R_eff = 1.27 ± 0.05
Rest of NSW: R_eff = 1.27 ± 0.07

(Cases shown on a log scale)

(note LGA data is several days old, does not include today's cases)

#covid19nsw #covidsydney
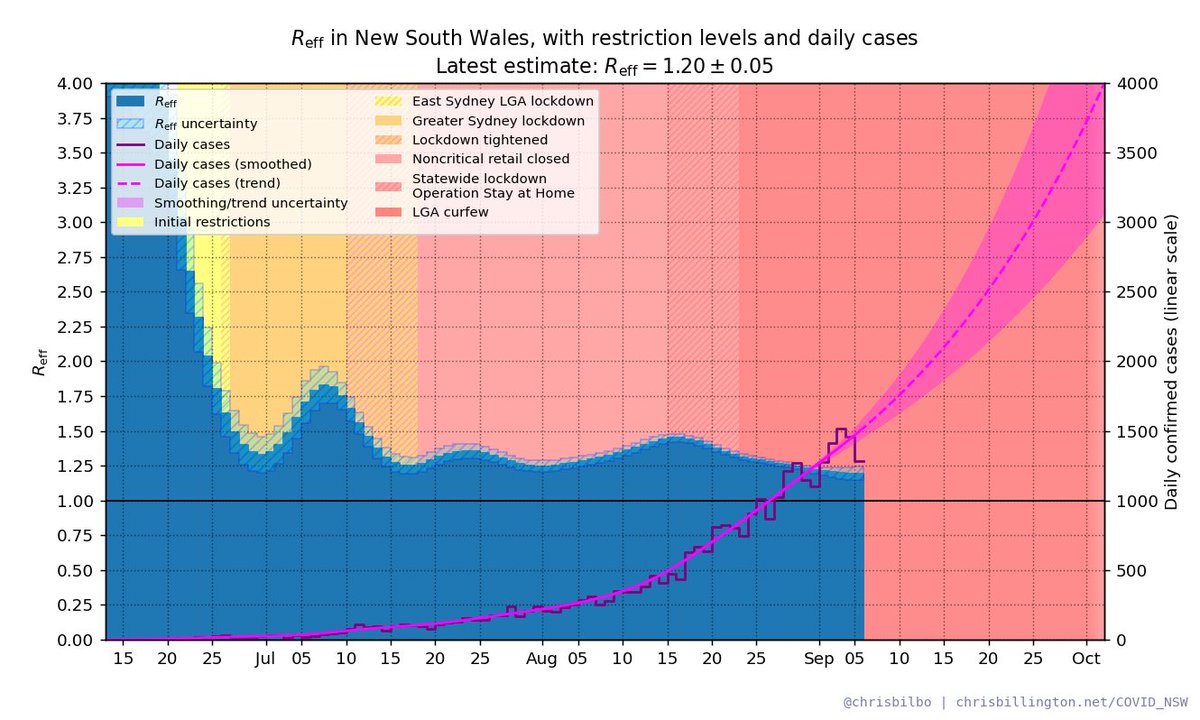
Expected numbers if the current trend continues:

day cases 68% range
Mon: 1619 1439—1788
Tue: 1688 1480—1901
Wed: 1758 1514—2004
Thu: 1827 1546—2118
Fri: 1894 1578—2224
Sat: 1958 1599—2342
Sun: 2027 1625—2448

Doubling time is 14.4 days.
Should say "cases shown on a linear scale" in the first tweet, apologies. The second tweet is a log scale.

• • •

Missing some Tweet in this thread? You can try to force a refresh
 

Keep Current with Chris Billington

Chris Billington Profile picture

Stay in touch and get notified when new unrolls are available from this author!

Read all threads

This Thread may be Removed Anytime!

PDF

Twitter may remove this content at anytime! Save it as PDF for later use!

Try unrolling a thread yourself!

how to unroll video
  1. Follow @ThreadReaderApp to mention us!

  2. From a Twitter thread mention us with a keyword "unroll"
@threadreaderapp unroll

Practice here first or read more on our help page!

More from @Chrisbilbo

6 Sep
Since the modelling the NSW gov has released is in terms of the LGAs of concern only, here's my model re-run with only the LGAs of concern considered instead of the whole of NSW. Result is extremely similar to that of the gov's modelling.
The smoothing for mine is centred though, meaning to compare with their 7-day moving average, you'll wanna push my projection to the right ~3.5 days. Taking that into account, it looks like my model is predicting a peak about ~1 week later than them, but of the same height.
And the difference in timing is pretty much within the uncertainty range of both projections, so they basically agree to within the accuracy claimed by each model
Read 4 tweets
6 Sep
NSW R_eff as of September 6th with daily cases and restrictions. Latest estimate: R_eff = 1.20 ± 0.05

Plus projected effect of vaccination rollout.

Cases shown on a linear scale (log scale in next tweet).

More info chrisbillington.net/COVID_NSW.html

#covid19nsw #covidsydney
NSW R_eff as of September 6th with daily cases and restrictions. Latest estimate: R_eff = 1.20 ± 0.05

Plus projected effect of vaccination rollout.

(Cases shown on a log scale)

More info chrisbillington.net/COVID_NSW.html

#covid19nsw #covidsydney
R_eff in LGAs of concern* vs the rest of NSW (*all of Penrith included):

LGAs of concern: R_eff = 1.28 ± 0.05
Rest of NSW: R_eff = 1.43 ± 0.07

(Cases shown on a log scale)

(note LGA data is several days old, does not include today's cases)

#covid19nsw #covidsydney
Read 4 tweets
5 Sep
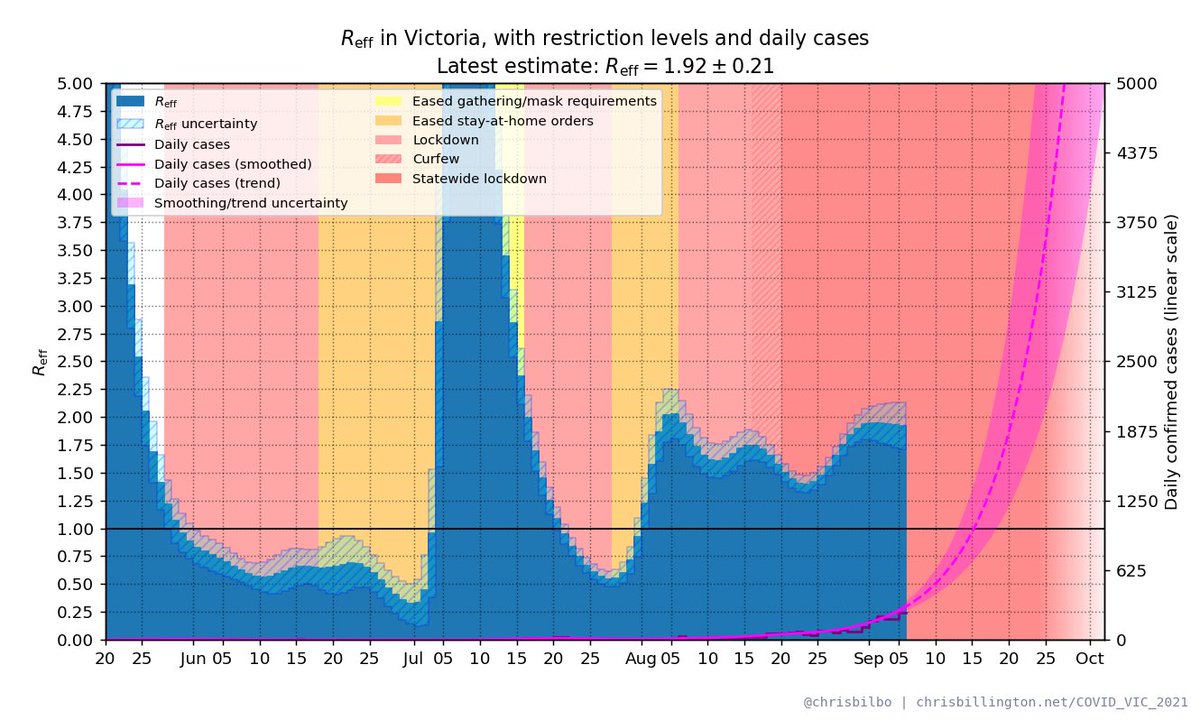
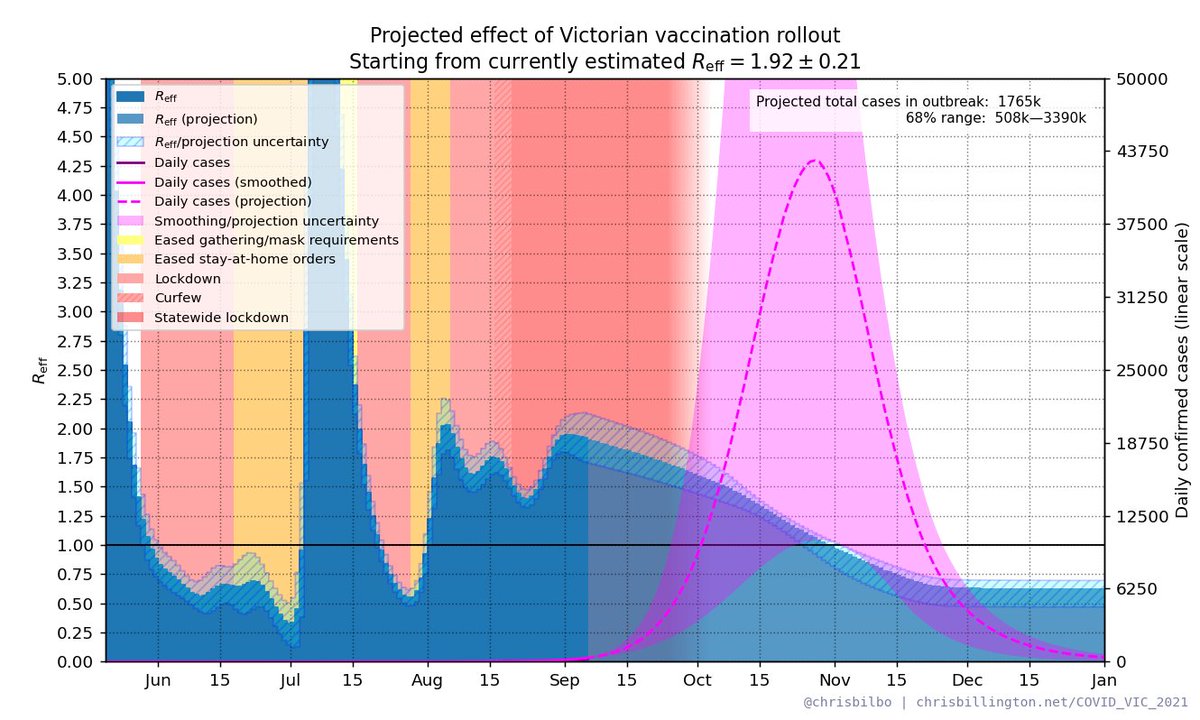
VIC R_eff as of September 6th with daily cases and restrictions. Latest estimate: R_eff = 1.92 ± 0.21

Plus projected effect of vaccination rollout.

Cases shown on a linear scale (log scale in next tweet).

More info chrisbillington.net/COVID_VIC_2021…

#COVID19Vic
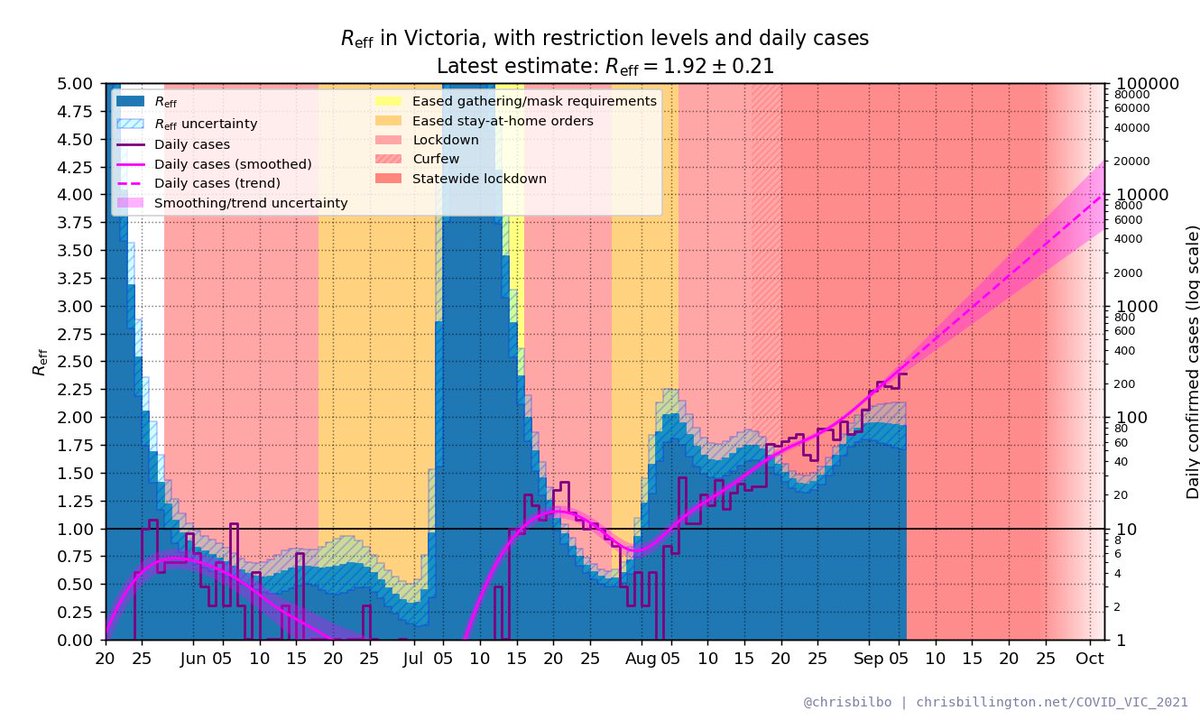
VIC R_eff as of September 6th with daily cases and restrictions. Latest estimate: R_eff = 1.92 ± 0.21

Plus projected effect of vaccination rollout.

(Cases shown on a log scale)

More info chrisbillington.net/COVID_VIC_2021…

#COVID19Vic
Expected numbers if the current trend continues:

day cases 68% range
Tue: 328 233—430
Wed: 386 255—531
Thu: 452 277—659
Fri: 527 301—811
Sat: 619 323—992
Sun: 721 345—1220
Mon: 838 369—1487

Doubling time is 5.5 days.

#COVID19Vic
Read 4 tweets
5 Sep
Animated version of my NSW projections over time. *not 100% identical to actual past projections because I'm using my current code running on old data and there have been some minor changes, but very close.
And the version with cases on a log scale
You can see that we did not see the projected effect of vaccinations for some time. If they were working as expected, something else must have been increasing R_eff at the same time. If you squint, maybe the decrease in R since mid-August has been in line with expectations.
Read 4 tweets
5 Sep
Some have written to me asking about vaccine assumptions, and how much they affect the projections. I assume a 40% overall reduction in transmission per dose - i.e. an 80% reduction for someone fully vaccinated. How much would it change things if that were different? 1/🧵
TL;DR, this much. Here's the current NSW projection with 70%, 80% and 88% reduction in spread assumed for fully vaccinated people (and half that for single-dosed). More on those numbers below. 2/🧵
The overall reduction in transmission from a vaccine comes from it preventing some fraction of infections—this is called E_i, and also preventing some fraction of onward transmission in the infections it doesn't prevent—this is called E_t. 3/🧵
Read 11 tweets
5 Sep
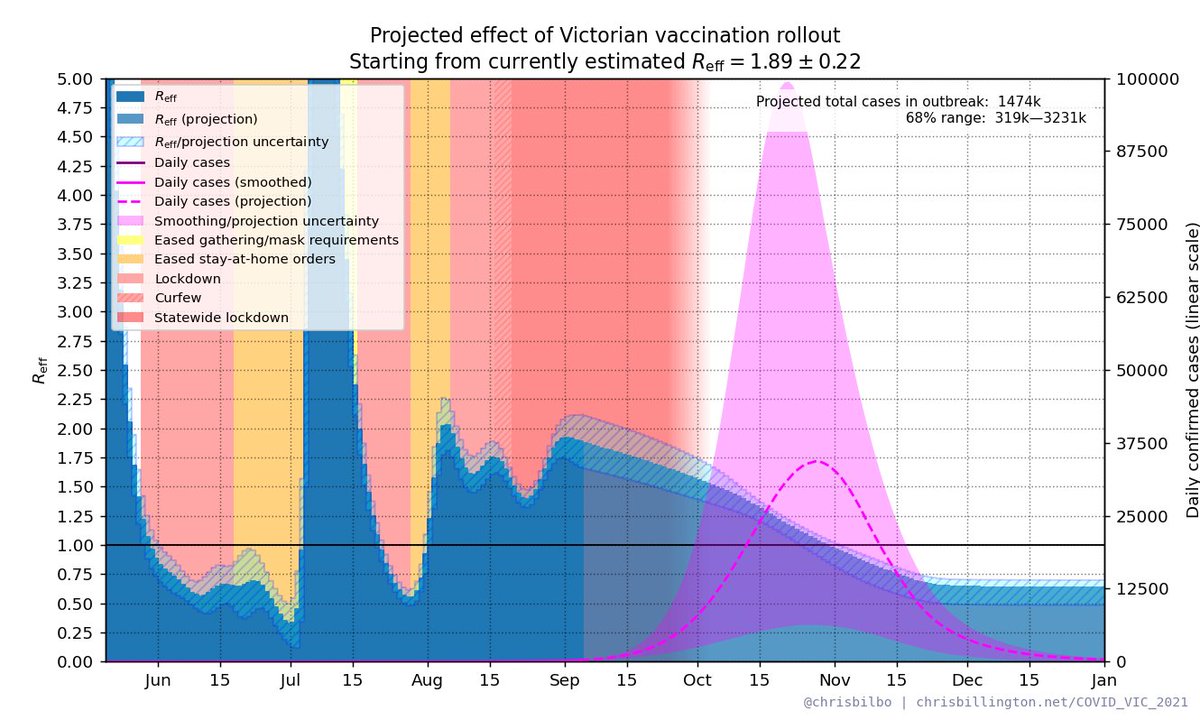
VIC R_eff as of September 5th with daily cases and restrictions. Latest estimate: R_eff = 1.89 ± 0.22

Plus projected effect of vaccination rollout.

Cases shown on a linear scale (log scale in next tweet).

More info chrisbillington.net/COVID_VIC_2021…

#COVID19Vic
VIC R_eff as of September 5th with daily cases and restrictions. Latest estimate: R_eff = 1.89 ± 0.22

Plus projected effect of vaccination rollout.

(Cases shown on a log scale)

More info chrisbillington.net/COVID_VIC_2021…

#COVID19Vic
Expected numbers if the current trend continues:

day cases 68% range
Mon: 281 192—378
Tue: 329 207—466
Wed: 384 221—573
Thu: 447 237—704
Fri: 520 251—864
Sat: 603 265—1054
Sun: 697 279—1285

Doubling time is 5.5 days.

#COVID19Vic
Read 5 tweets

Did Thread Reader help you today?

Support us! We are indie developers!


This site is made by just two indie developers on a laptop doing marketing, support and development! Read more about the story.

Become a Premium Member ($3/month or $30/year) and get exclusive features!

Become Premium

Too expensive? Make a small donation by buying us coffee ($5) or help with server cost ($10)

Donate via Paypal Become our Patreon

Thank you for your support!

Follow Us on Twitter!

:(