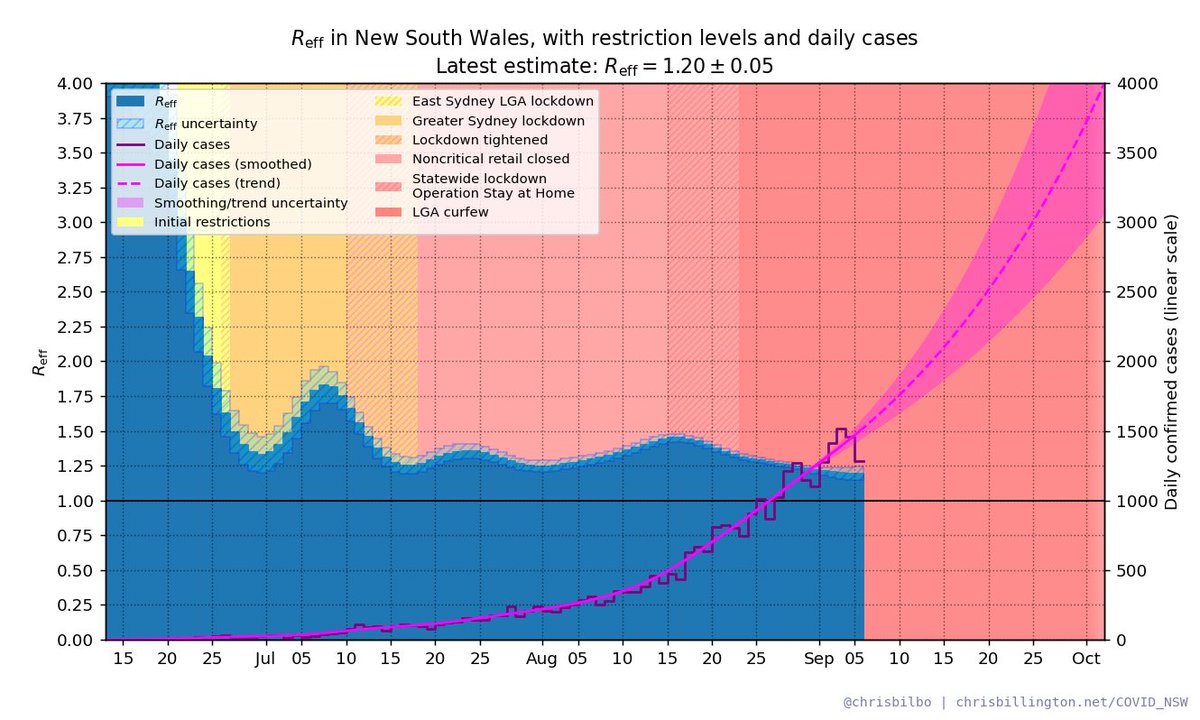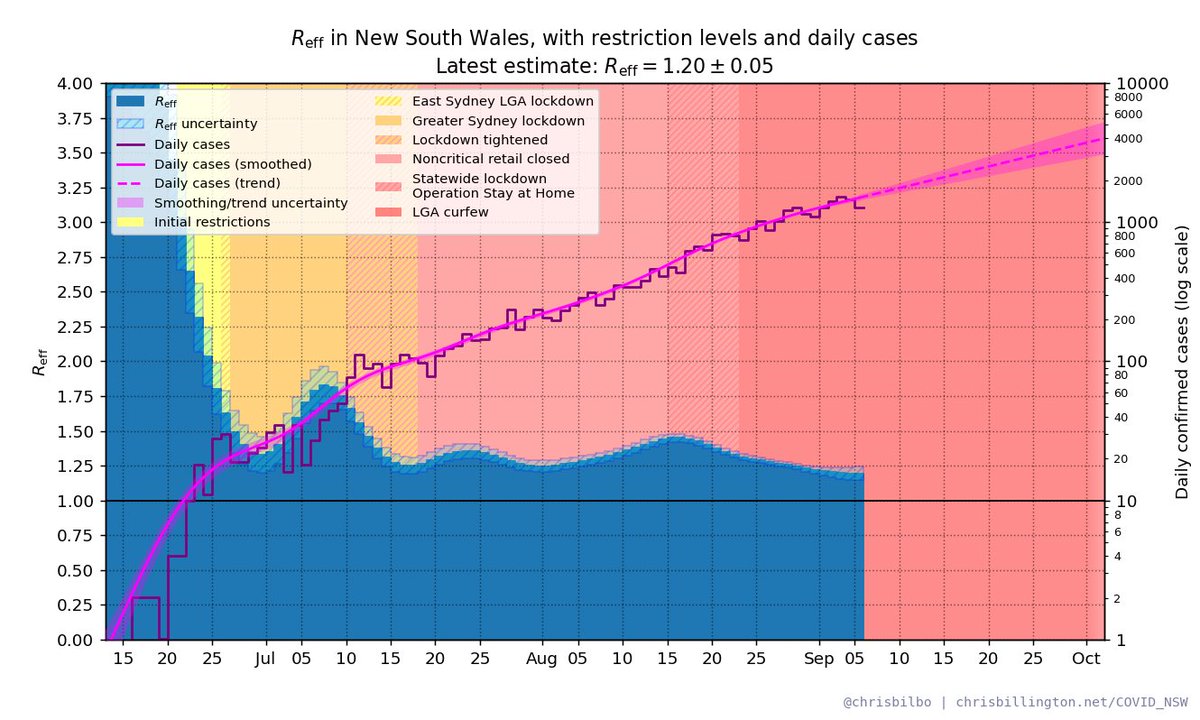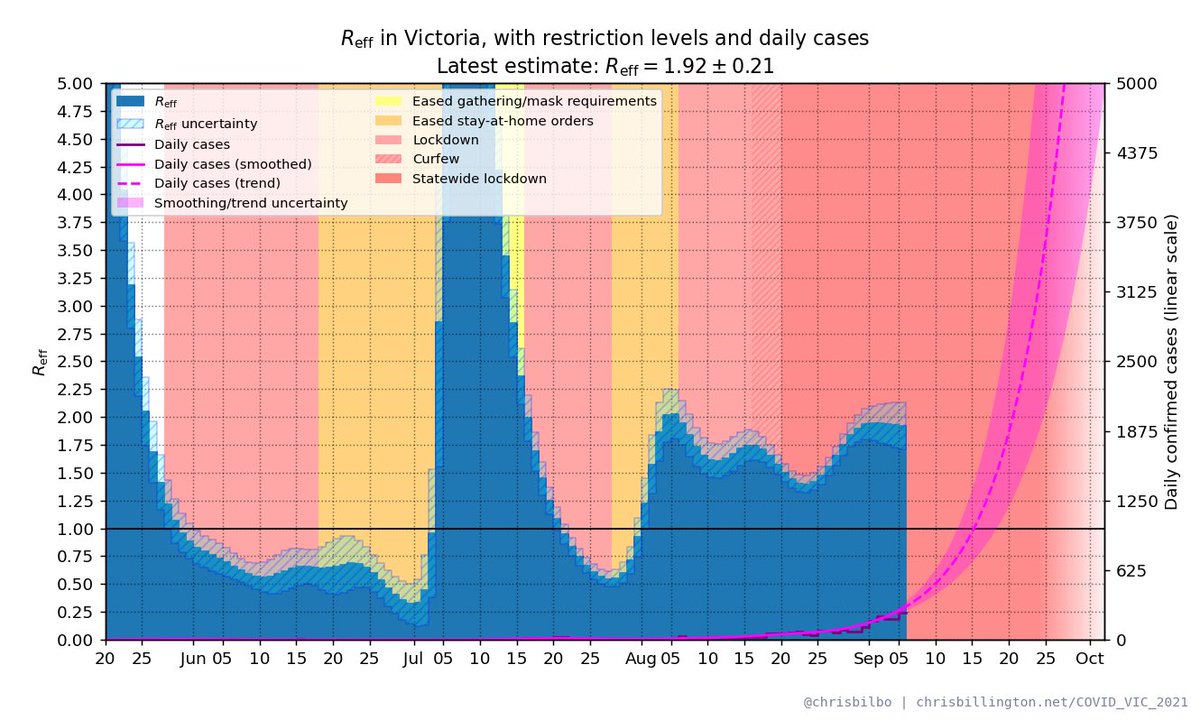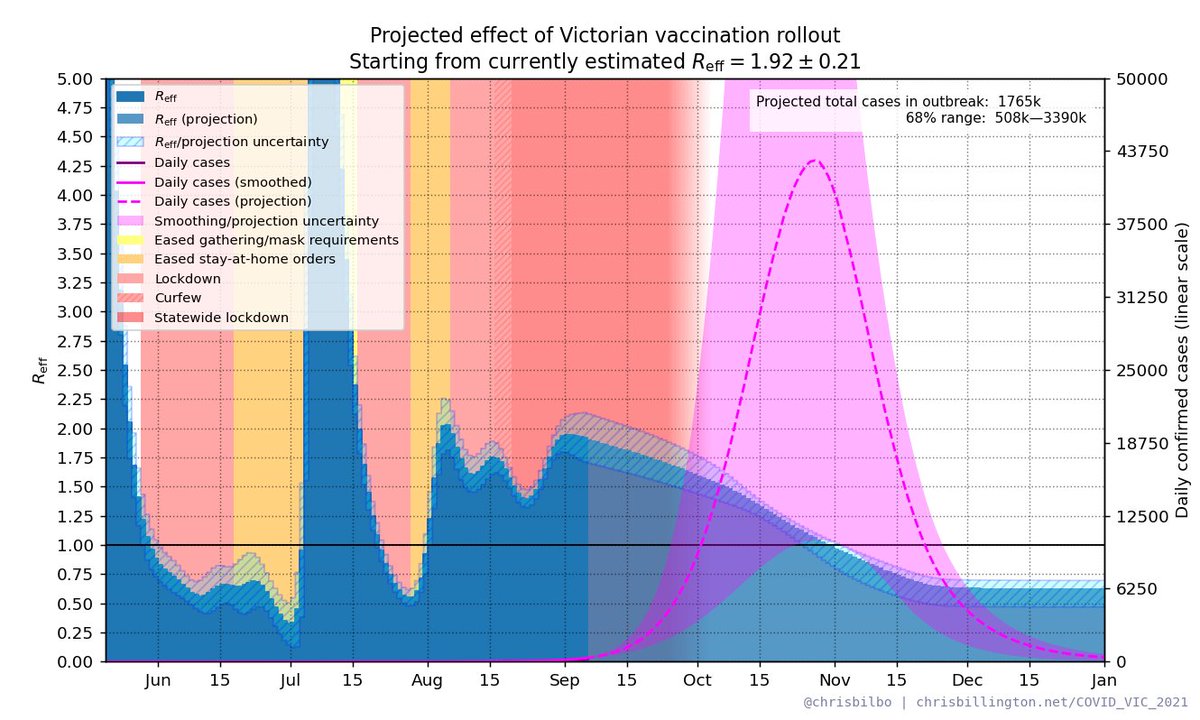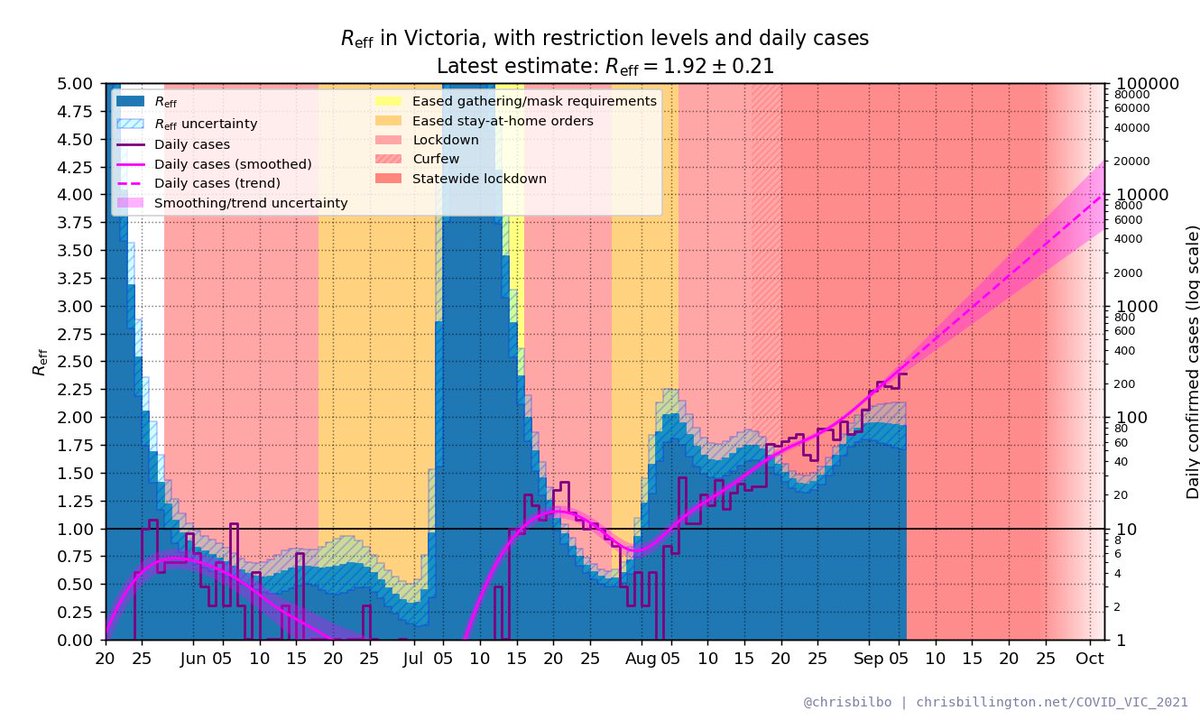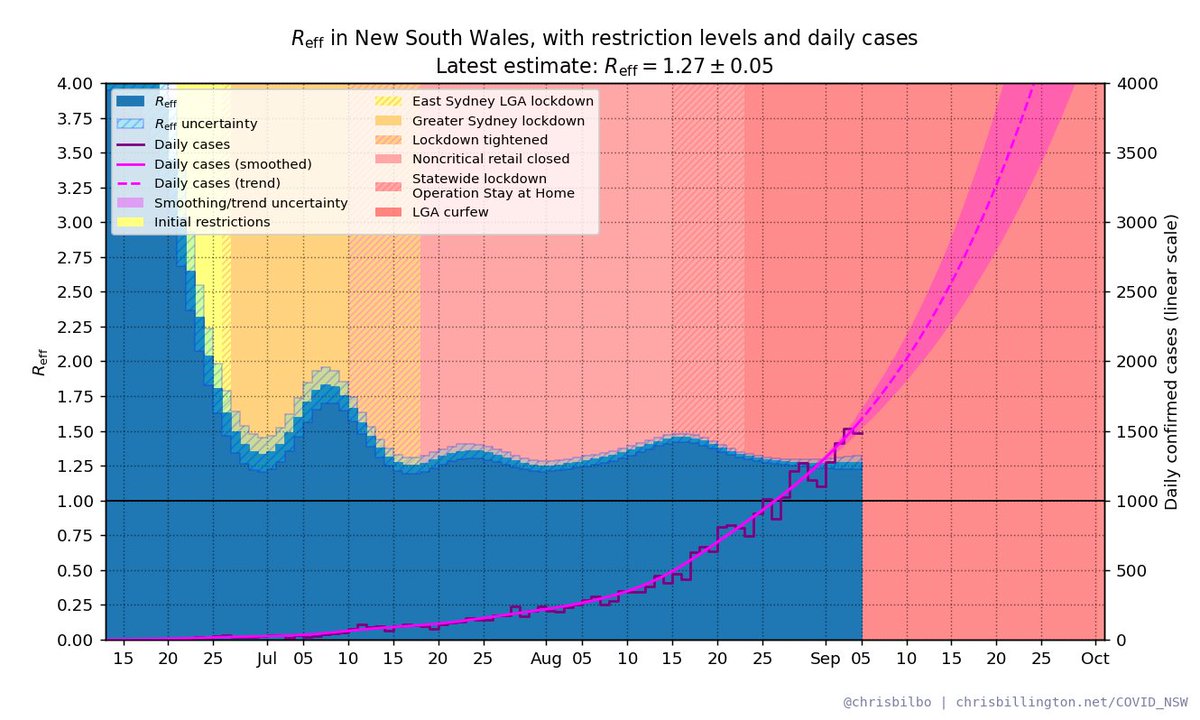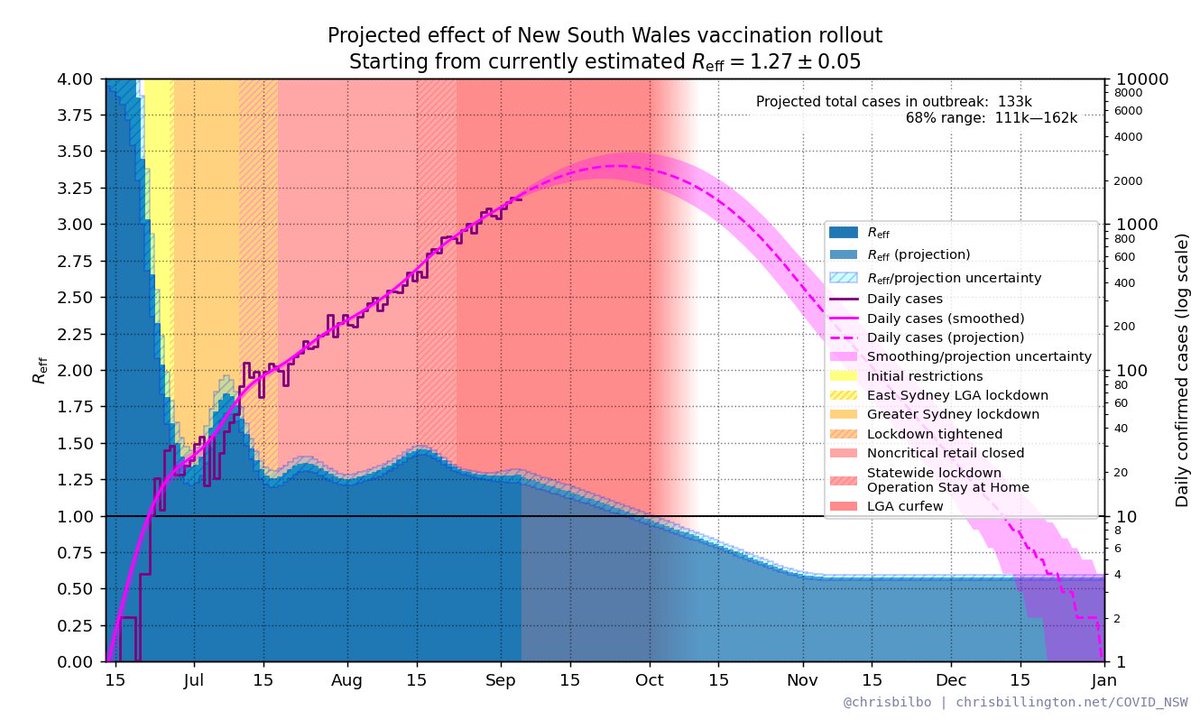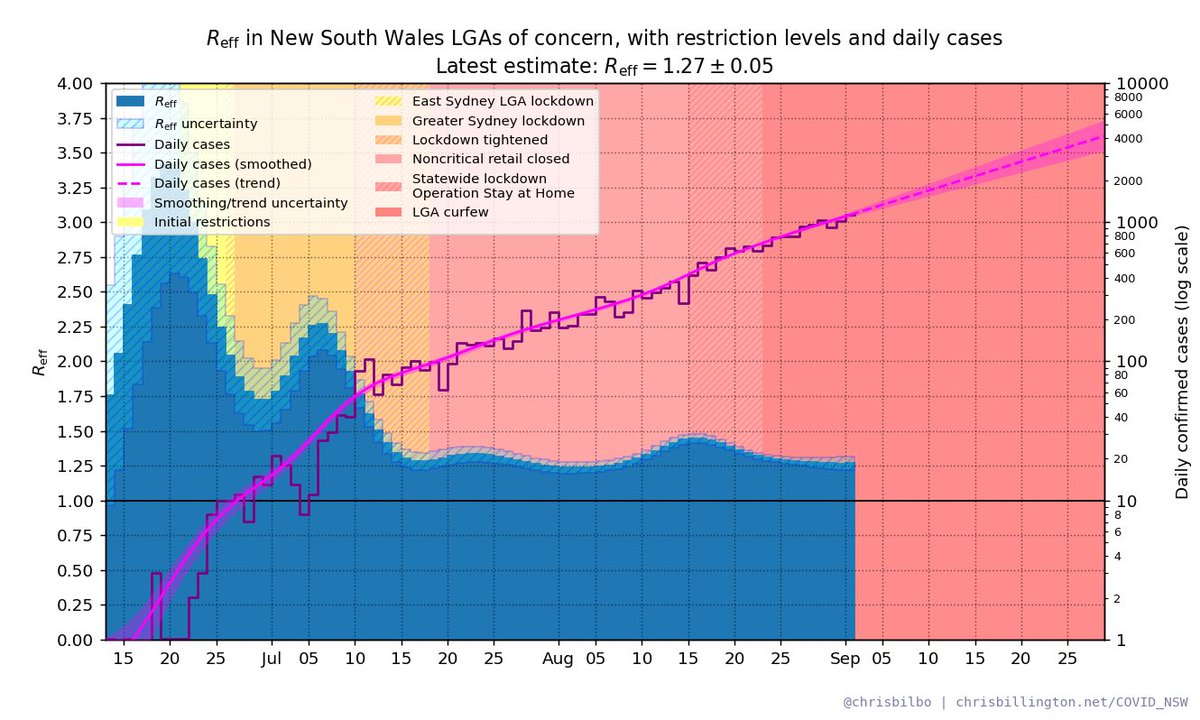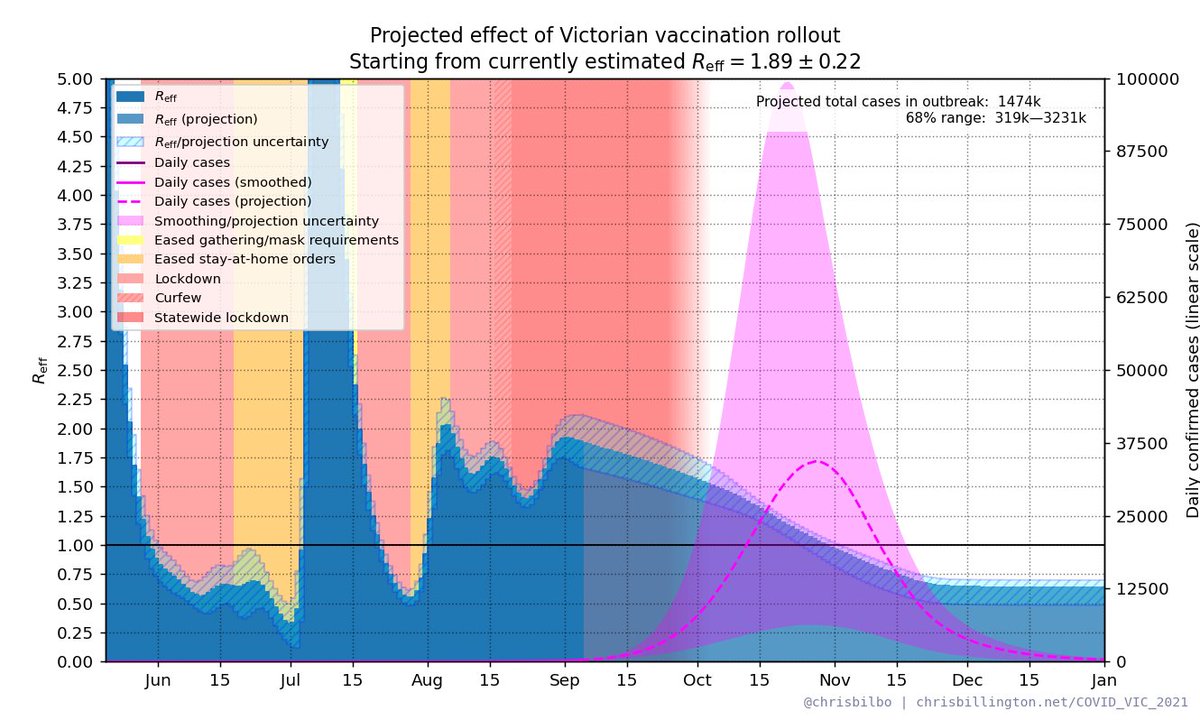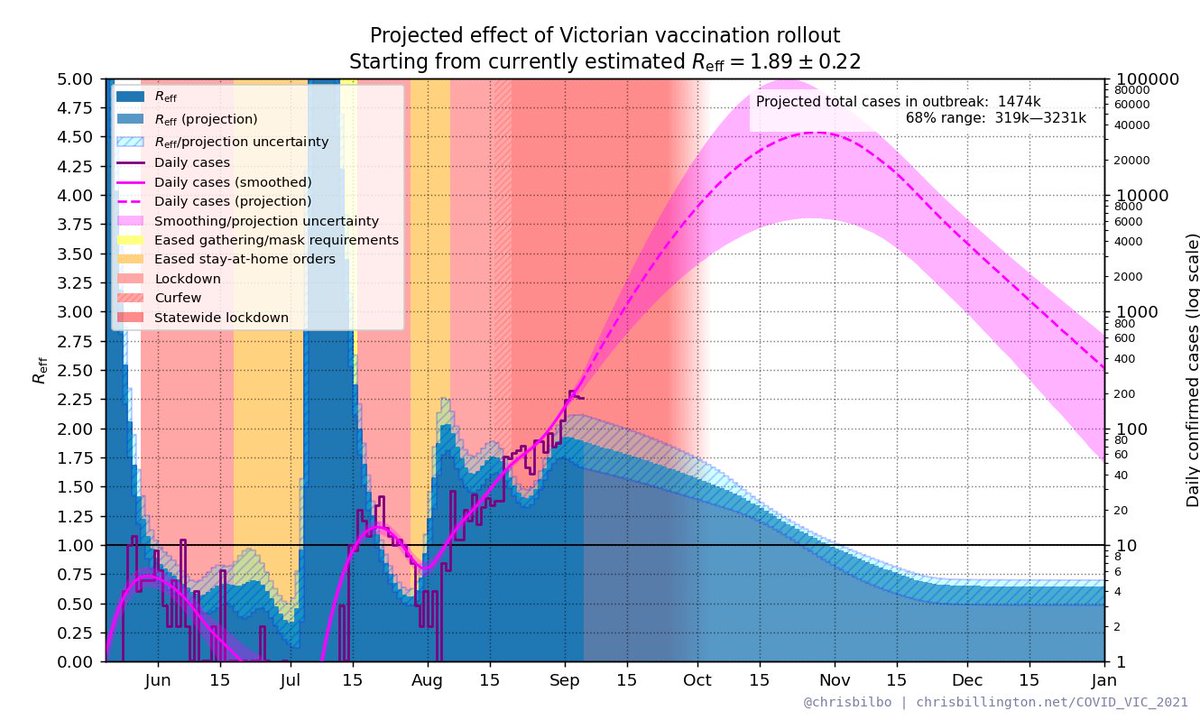
Some have written to me asking about vaccine assumptions, and how much they affect the projections. I assume a 40% overall reduction in transmission per dose - i.e. an 80% reduction for someone fully vaccinated. How much would it change things if that were different? 1/🧵
TL;DR, this much. Here's the current NSW projection with 70%, 80% and 88% reduction in spread assumed for fully vaccinated people (and half that for single-dosed). More on those numbers below. 2/🧵
The overall reduction in transmission from a vaccine comes from it preventing some fraction of infections—this is called E_i, and also preventing some fraction of onward transmission in the infections it doesn't prevent—this is called E_t. 3/🧵
The overall reduction is then 1 - (1 - E_i)×(1 - E_t). So a vaccine that prevents 60% of infections, and 50% of transmission, reduces overall transmission by 80%. 4/🧵
See this pastebin for some arguments and references for why I think those numbers are reasonable: pastebin.com/raw/66C0ExvZ. See the Oxford study in particular (ndm.ox.ac.uk/files/coronavi…), which measures E_i of the AZ vaccines against delta to be about 60%. 5/🧵
But there's a confidence interval there. Maybe the vaccine only prevents 50% of infections. Maybe it prevents 70%. We don't have much data on E_t for delta, but typically for other variants it's about 50%. But let's consider a range: 40% to 60%. 6/🧵
Taking the lower and upper ends of both ranges for E_i and E_t and feeding them to our formula for the overall reduction in transmission gives the range 70% to 88%. Roughly speaking, this is a range in which the true efficacy of the vaccines against transmission might lie. 7/🧵
And how much does that affect our expectations for the outbreak in NSW? Back to the gif again, this much. The peak could be a bit higher or lower, and a bit earlier or later. 8/🧵
So the exact efficacy of the vaccines against spread doesn't affect very much whether or when the outbreak in NSW will peak. What it will matter more for is how much restrictions can be loosened after the peak without cases growing again. 9/🧵
The final level of coverage will also matter a lot at that point. We will still be very interested in exactly how good the vaccines are at what they do - including of course, prevention of severe disease. 10/🧵
But over the next few weeks, our expectations of how things will play out in NSW are probably not that sensitive to the exact efficacy of the vaccines against spread. Unless we're grossly wrong about the vaccines in this respect, NSW's next few weeks seem fairly clear. 11/11
• • •
Missing some Tweet in this thread? You can try to
force a refresh


