G a a h Profile picture
Sep 6, 2021 10 tweets 4 min read Read on X
Time seems to tell about a new historical top! #Bitcoin

-Price starting from Halving:

Is it possible for this cycle to be the longest lasting?
It still has time if it repeats like 2016, as the previous cycle was longer compared to 2012.

Follow the Thread [6]👇👇 Image
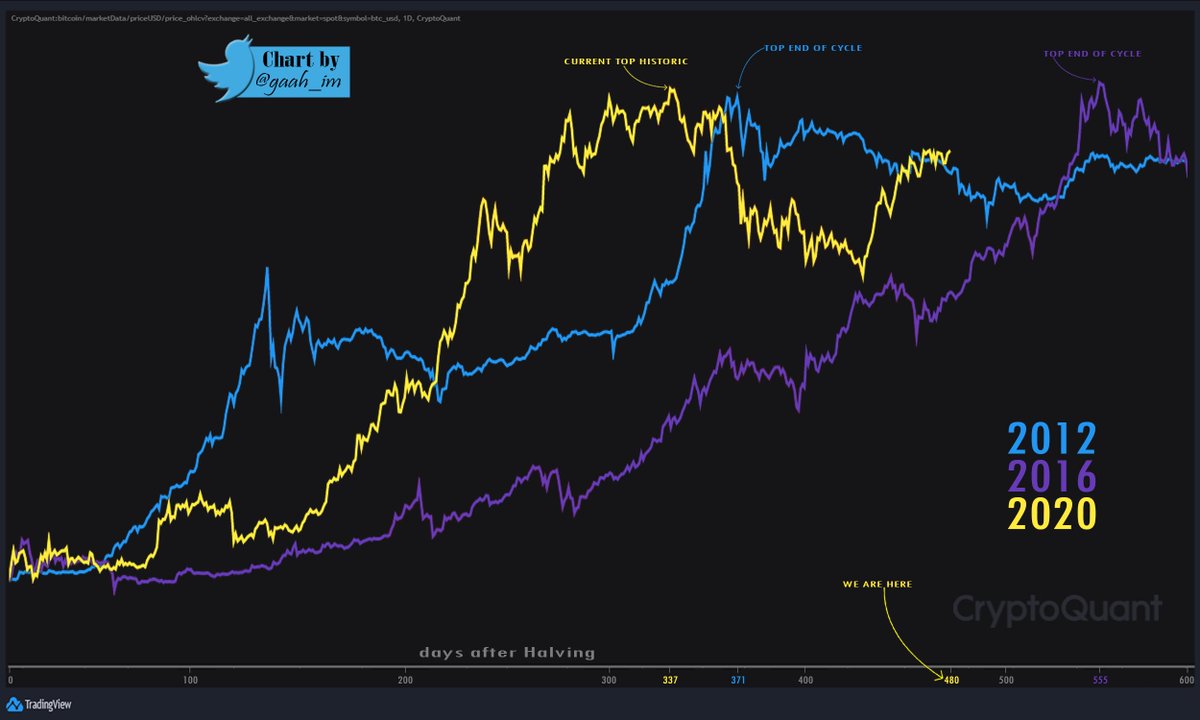
-Price from the breaking of the last ATH:

It is earlier than all cycles. The historical suggestion is that there is still enough time to make new corrections as well as new ATHs. Image
1/6 2011 occurred 4 corrections with an average duration of 80 days. These being between -40% to -55% depth. Image
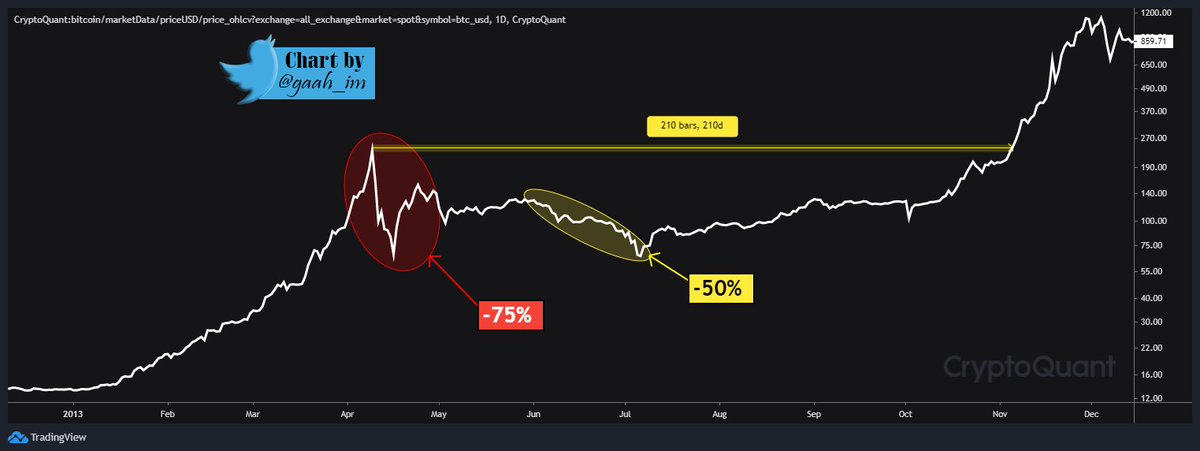
2/6 2013 only a single correction of -75% depth, it took about 210 days to resume the last top. After a brief price rebound after the big dip, in 36 days it fell -50%, from here on it only recovered high again. Image
3/6 2017 occurred 3 price corrections, with an average duration of 35 days to resume the last top and trend continuation. The depth of the dips were between -30% to -40%. Image
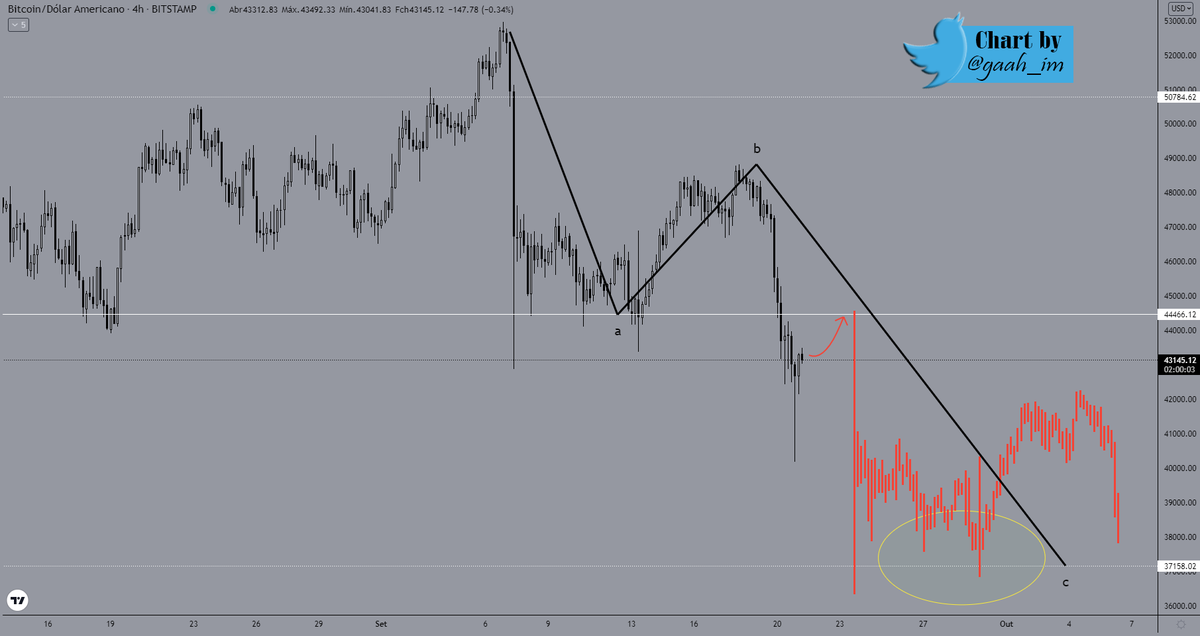
4/6 It already currently went through a correction earlier this year and is now going through a second one that we can only really confirm after breaking the last top ($65,000). The corrections are between -30% to -55% depth. 👇
It took about 30 days to recover the first retracement, while the correction that is still in effect is 140 days from the last top.

5/6 There is a brief resemblance to the first cycle, although the corrections were more aggressive and in greater numbers.👇 Image
If this cycle gets even more similar to 2011 in the pattern of corrections, there are still 2 corrections to contend with, suggesting new ATH.

Still also equal in the corrective aspect in quantity compared to 2017, as retracements were less aggressive in terms of percentage.
6/6 Looking from Halving, the top of 2011 and 2013 were faster, as 2017 took longer than all so far, this may be the case again. The current cycle is longer than all previous ones, including 2017.

The cycles are similar in the technical aspect and correction pattern.👇
The point is: The moments that occurred in the past have similarities to the present movements, the suggestion is that we still go higher!

See also at Quicktake:
cryptoquant.com/quicktake/6135…

-If you like my cycle analysis leave a RT/like🙌, Thanks ! Count on me🤜🤛😉

• • •

Missing some Tweet in this thread? You can try to force a refresh
 

Keep Current with G a a h

G a a h Profile picture

Stay in touch and get notified when new unrolls are available from this author!

Read all threads

This Thread may be Removed Anytime!

PDF

Twitter may remove this content at anytime! Save it as PDF for later use!

Try unrolling a thread yourself!

how to unroll video
  1. Follow @ThreadReaderApp to mention us!

  2. From a Twitter thread mention us with a keyword "unroll"
@threadreaderapp unroll

Practice here first or read more on our help page!

More from @gaah_im

May 19, 2022
#Bitcoin 's "post Halving cycle" is compromised.

After each new Halving the price has developed cyclically different behavior.
The structures are similar, but not the same.

-Follow the thread below👇 1/5🧵
In 2013 the price advanced 2 full channels (3 phases), leaving the first move without phase4.

In 2017 price advanced only 1 full channel (3 phases) besides phase 4 being the fastest in history, until then.

#BTC #Bitcoin

2/5🧵
In the current cycle, in 2021, price stopped at phase2 and did not realize phase3, besides realizing phase4 after phase1 and now being inside phase4 again.

A cyclical mess. #BTC

3/5🧵
Read 5 tweets
Mar 18, 2022
The price has tried the last 3 times to break $40.8k and was successful, next testing $44.4k.

However it came back all 3 times equally, ripping down in search of $37k.

This time price is fighting with high volatility at $40.8k

#Bitcoin

1/4🧵
$40.8k is the key to probability being in favor of a trend reversal (breaking $44.4k), currently the risk of breaking $37k still exists if $40.8k continues to be Resistance!

2/4🧵

Below $37k the Bears are "forcing the bar", so this is the strategic point to be held by the Bulls for the accumulation structure ($60k-$30k) to remain bullish.

50% of the reference channel balances the strength of the armies (Bull vs. Bear).

3/4🧵
Read 4 tweets
Mar 17, 2022
During an uptrend people rush to buy and sell with a sense of desperation, not wanting to be left out of valuations.

Such holders move the Network at these times, creating UTXO/spending UTXO at a profit.

#Bitcoin

1/5🧵
After a spent output is realized, the price in USD of the UTXO created/UTXO spent shows whether the UTXO realized profit/loss.

With one more variable (lifespan) included, in the realization it categorizes whether it is STH(age 1h~155days) or LTH(age >155days).

2/5🧵
That said, when demand is hot in the short to medium term, the reflection in the chain by Short Term Holders (STH) is shown by the #SOPR.

3/5🧵
Read 5 tweets
Sep 23, 2021
The best time to buy #Bitcoin is now!

The ratio MVRV is defined as the market capitalization of an asset divided by the realized capitalization. With this indicator it is possible to map the behavior in previous cycles and define the revenue of the current moment.

Thread👇👇
1. Ranking the phases of the cycles in sequence of 1-3 starting with NUMBER 1 after the start of the bull market and the top meeting in the middle of the bullish cycle.
2. There is a historical moment in the middle of the bull run, where it always looks like the end of the valuation, however it is just a short-term top in the middle of the bullish run. By hitting that top and offering the best buying moment within the bull market, 👇
Read 16 tweets
Sep 22, 2021
3.5 channel breaks in 2013, reversal requires 4 total channel breaks, totaling 1 entire sub-cycle.
2.5 channel breaks in the correction we are currently in, much softer than 2013 even retracing -55% since the last top.
After testing in the Neutral Zone, retracement to the stealth point (50% of the REFERENCE CHANNEL) historically occurs.

This point is important as it is where market sentiment turned, as well as being the daily close of the first dip and also the bar close of the Monthly chart.
Read 8 tweets
Sep 21, 2021
The yellow dotted arrow shows the complete move, it advances 0.5 of the channel in a complete move.

The breakout attempt above 50% led to the trap, and is discounted later in the PIVOT to miss the main bottom of the last few pattern moves. Image
Breaking through sets up a new full move and hits $37k, at the stealth point of the price rebound.

It has only walked 0.5 of the move (the discount at 50% and at the PIVOT). This moment is crucial for the Bulls to advance above $44,400 and have a daily close. Image
If this does not happen, the full move must be completed.

The quick turn around after the dip to $40k has a high probability of being Short positions.

Interest at this time in opening short positions should increase as sentiment is in fear and speculators take advantage. Image
Read 4 tweets

Did Thread Reader help you today?

Support us! We are indie developers!


This site is made by just two indie developers on a laptop doing marketing, support and development! Read more about the story.

Become a Premium Member ($3/month or $30/year) and get exclusive features!

Become Premium

Don't want to be a Premium member but still want to support us?

Make a small donation by buying us coffee ($5) or help with server cost ($10)

Donate via Paypal

Or Donate anonymously using crypto!

Ethereum

0xfe58350B80634f60Fa6Dc149a72b4DFbc17D341E copy

Bitcoin

3ATGMxNzCUFzxpMCHL5sWSt4DVtS8UqXpi copy

Thank you for your support!

Follow Us!

:(