𝗖𝗧𝗠 #𝗕𝗧𝗖 𝗢𝗻-𝗖𝗵𝗮𝗶𝗻 𝗠𝗲𝘁𝗿𝗶𝗰 𝗗𝗮𝘀𝗵𝗯𝗼𝗮𝗿𝗱: 𝗪𝗸 𝟯𝟱 '𝟮𝟭
Price Action Indicators
TLDR: 📈
1. Miner metrics- Slightly bullish
2. Supply metrics- Bullish
3. Institution demand- Slightly Bullish
4. Network metric- Slightly bullish
5. Trading- Buy
Price Action Indicators
TLDR: 📈
1. Miner metrics- Slightly bullish
2. Supply metrics- Bullish
3. Institution demand- Slightly Bullish
4. Network metric- Slightly bullish
5. Trading- Buy
𝟭. 𝗠𝗶𝗻𝗲𝗿 𝗠𝗲𝘁𝗿𝗶𝗰𝘀
a. The mean hash rate for #BTC miners has bottomed & is trending higher. It's forming an ascending channel, which is a bullish pattern.
The hash rate held the upward trend & pierced through the middle of the parallel channel last week. Bullish.
a. The mean hash rate for #BTC miners has bottomed & is trending higher. It's forming an ascending channel, which is a bullish pattern.
The hash rate held the upward trend & pierced through the middle of the parallel channel last week. Bullish.

1b (i) The Hash Ribbon is a market indicator that assumes that #BTC's price tends to reach a bottom when miners capitulate & that's when BTC's price momentum switches from negative to positive- a good buying opportunity.
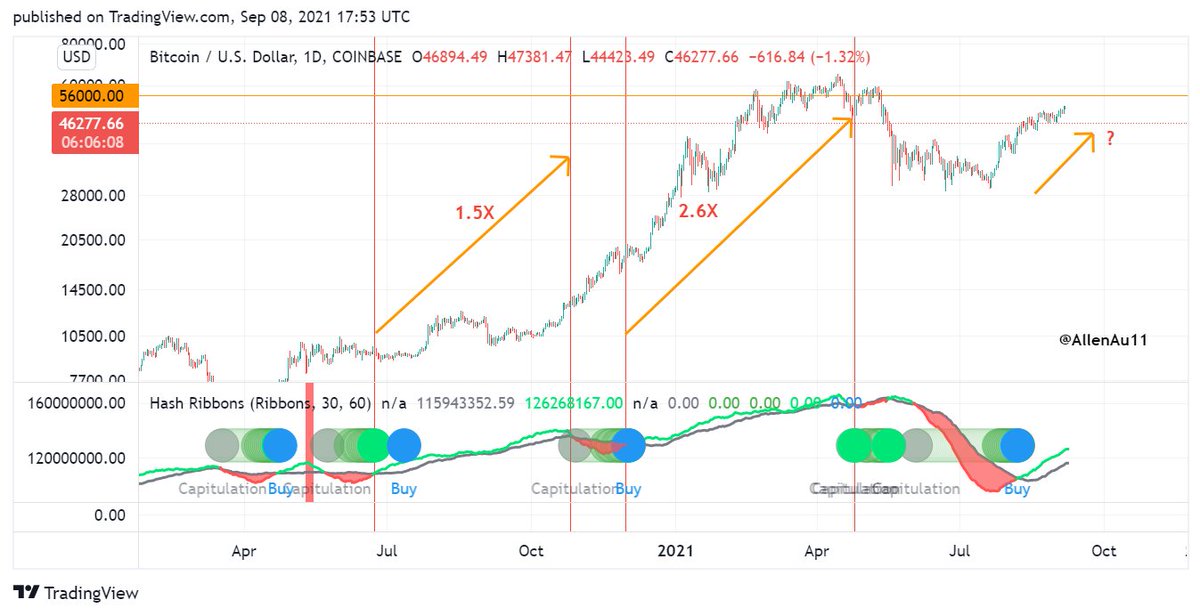
b (ii) The Hash Ribbon flashed buy signals twice during this bull phase & #BTC's price rallied by 1.5x-2.6x. Hash Ribbon buy signal was still intact last week.
If history repeats, this will put BTC between $61K-$106K!
If history repeats, this will put BTC between $61K-$106K!
1c. #BTC miner balance decreased by 1507 BTC last week. Miners were probably taking some profits ahead of the El Salvador Bitcoin Day on 9/7/21.
Weekly change: -1507 BTC
Monthly change: -658 BTC
Bearish!
Weekly change: -1507 BTC
Monthly change: -658 BTC
Bearish!
𝟮. 𝗦𝘂𝗽𝗽𝗹𝘆 𝗠𝗲𝘁𝗿𝗶𝗰𝘀
a. The Net #BTC Transfer Volume to/from Exchanges (NTVE) is inversely correlated with BTC price.
NTVE was net negative last week & that supported the BTC price surge to $52K.
BTC could still peak at $360K based on my pinned tweet under 2(ii)(c).
a. The Net #BTC Transfer Volume to/from Exchanges (NTVE) is inversely correlated with BTC price.
NTVE was net negative last week & that supported the BTC price surge to $52K.
BTC could still peak at $360K based on my pinned tweet under 2(ii)(c).


2b. The Balance of #BTC on Exchanges decreased by 31547 BTC last week. This was supportive of BTC's price to go up to $52K last week.

2c. Last week, Whales bought 31065 #BTC, while everyone else took profits as BTC's price went up to $52K.
Last month, non-Whales bought 26027 BTC, but they dumped almost their entire holding (24459) in the 1st week of September! Non-Whales front running the Whales?!
Last month, non-Whales bought 26027 BTC, but they dumped almost their entire holding (24459) in the 1st week of September! Non-Whales front running the Whales?!

2d The #BTC supply held by long-term HODLers falls as BTC's price ascends to its interim or cycle peak. It then gradually goes up after the cycle peak.
The current trend of "old coins" mimics the 2013 cycle so BTC's price should have another powerful leg up!
The current trend of "old coins" mimics the 2013 cycle so BTC's price should have another powerful leg up!

𝟯. 𝗜𝗻𝘀𝘁𝗶𝘁𝘂𝘁𝗶𝗼𝗻𝗮𝗹 𝗗𝗲𝗺𝗮𝗻𝗱
In the last 7 days, 21712 BTC or $1.06B worth of #BTC were withdrawn from Coinbase to cold storage. This is a 55% drop from last week's amount!
Institutions were cautious to scoop up BTC as BTC's price increased to $52K.
In the last 7 days, 21712 BTC or $1.06B worth of #BTC were withdrawn from Coinbase to cold storage. This is a 55% drop from last week's amount!
Institutions were cautious to scoop up BTC as BTC's price increased to $52K.

𝟰. 𝗡𝗲𝘁𝘄𝗼𝗿𝗸 𝗠𝗲𝘁𝗿𝗶𝗰𝘀
#BTC RVT Ratio is the realized market cap of BTC to transaction volume ratio.
RVT Ratio is now in Moderate Activity & trending toward High Activity. If this trend continues, BTC should rally like it did a few months ago.
#BTC RVT Ratio is the realized market cap of BTC to transaction volume ratio.
RVT Ratio is now in Moderate Activity & trending toward High Activity. If this trend continues, BTC should rally like it did a few months ago.

𝟱. 𝗧𝗿𝗮𝗱𝗶𝗻𝗴
a. aSOPR is forming a bullish ascending broadening wedge pattern. If aSOPR > 1, profitable coins realize profits & #BTC's price corrects. It then resets back to ~1 signaling the dip is bought. aSOPR trades higher repeating the rally higher.
Bullish!
a. aSOPR is forming a bullish ascending broadening wedge pattern. If aSOPR > 1, profitable coins realize profits & #BTC's price corrects. It then resets back to ~1 signaling the dip is bought. aSOPR trades higher repeating the rally higher.
Bullish!

5b. MRGO-14 uses the difference in changes in #BTC's market & realized price to find buy/sell signals for BTC.
Green ➡️ Buy
Red ➡️ Sell
MRGO-14 has been green since 7/25/21. Its duration already exceeds that of the 12/16/20-1/18/21 rally, which lasted 34 days.
Green ➡️ Buy
Red ➡️ Sell
MRGO-14 has been green since 7/25/21. Its duration already exceeds that of the 12/16/20-1/18/21 rally, which lasted 34 days.

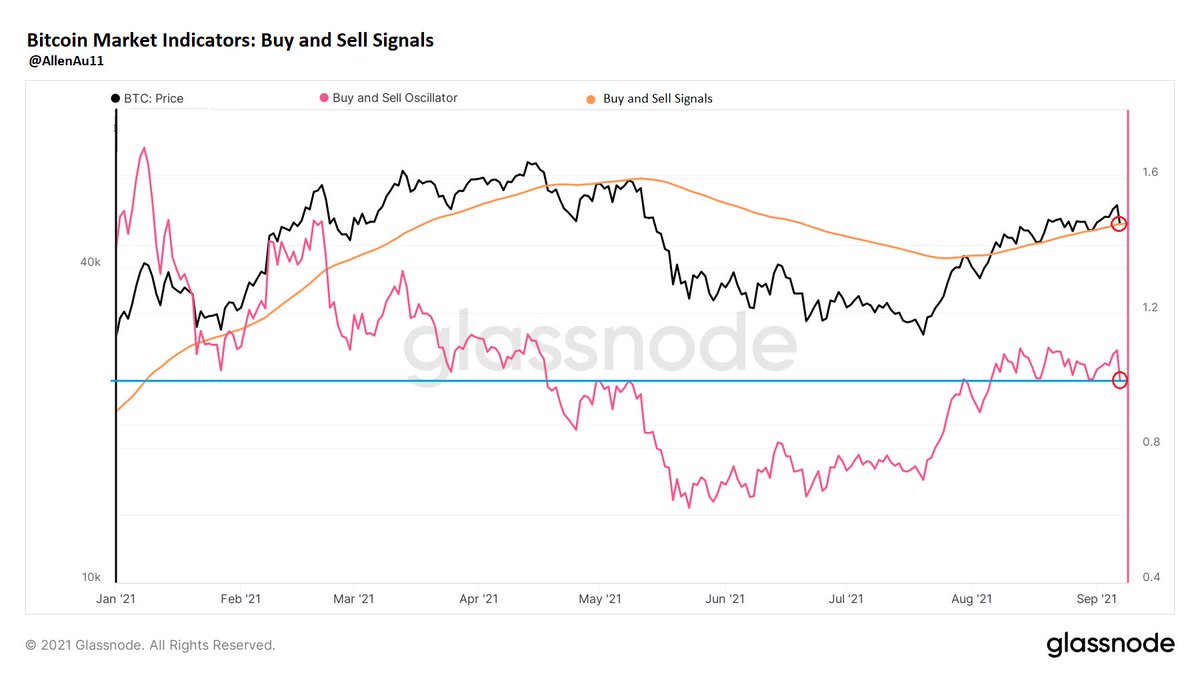
5c. Buy & Sell Oscillator
Simple
Oscillator crosses above 1➡️Buy
Oscillator crosses below 1 ➡️Sell
Oscillator >2➡️Interim or cycle top
Advanced
Oscillator > 1 &📈➡️Accumulate
Oscillator > 1 & 📉➡️Take profit
Oscillator < 1 &📉➡️Short
Oscillator < 1 & 📈➡️Close shorts
Buy!👀
Simple
Oscillator crosses above 1➡️Buy
Oscillator crosses below 1 ➡️Sell
Oscillator >2➡️Interim or cycle top
Advanced
Oscillator > 1 &📈➡️Accumulate
Oscillator > 1 & 📉➡️Take profit
Oscillator < 1 &📉➡️Short
Oscillator < 1 & 📈➡️Close shorts
Buy!👀
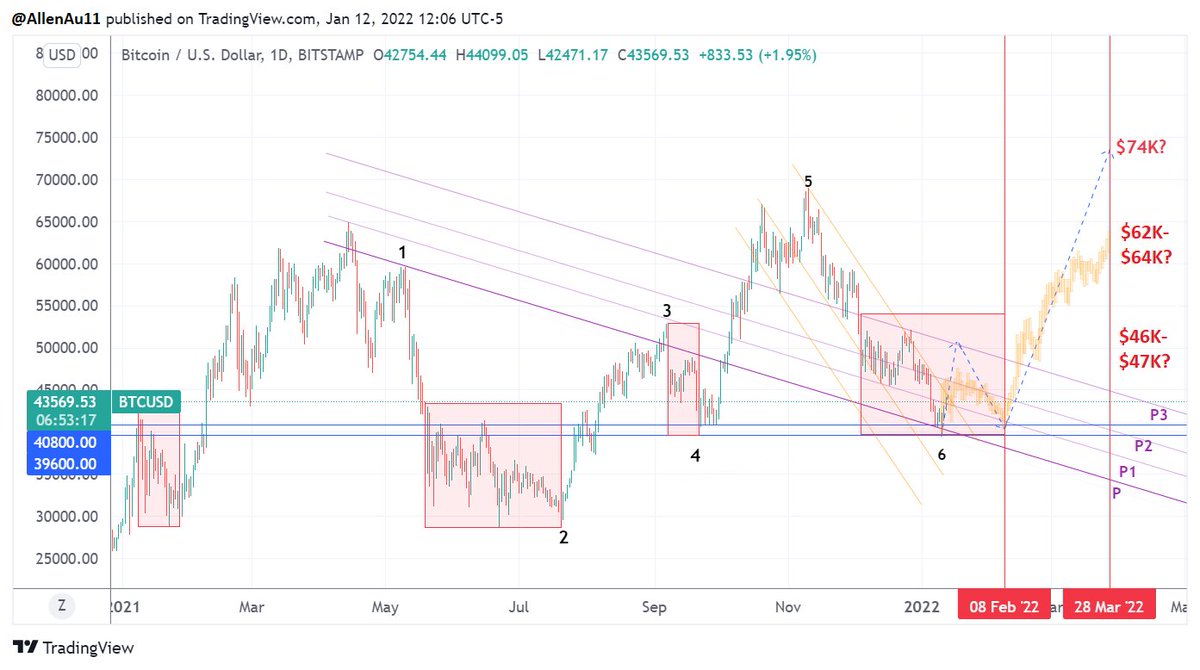
5d. We can also use #BTC realized volume to see where the major support & resistance levels of the current trading range are.
Blue numbers are support levels & red numbers are resistance levels.
Blue numbers are support levels & red numbers are resistance levels.

5f. Based on the trading metrics, the trend is still positive, but need to watch if MRGO-14 will turn red & Buy & Sell Oscillator will flip < 1 in Week 36.
* Starting next week, the Trading Section will be separated out from the Price Action Indicators for more timely updates.
* Starting next week, the Trading Section will be separated out from the Price Action Indicators for more timely updates.
• • •
Missing some Tweet in this thread? You can try to
force a refresh