
Dad 👨👩, husband, businessman, growth stocks and #Bitcoin enthusiast; Humanity Forward; Princeton, Stanford & 49ers🏈, SFGiants⚾. Always learning to improve.
 1. #BTC's fundamentals as reflected by key on-chain data are strong. Hash rate has reached a new ATH. LT HODLers continue to hold onto their BTC despite BTC's recent correction. Supply dynamics favor a continuation of the bull run rather than BTC diving into a bear phase.
 1a/ The #BTC Cycle Peak Dash Board is revamped with the update of the Top Cap & BLX Models.
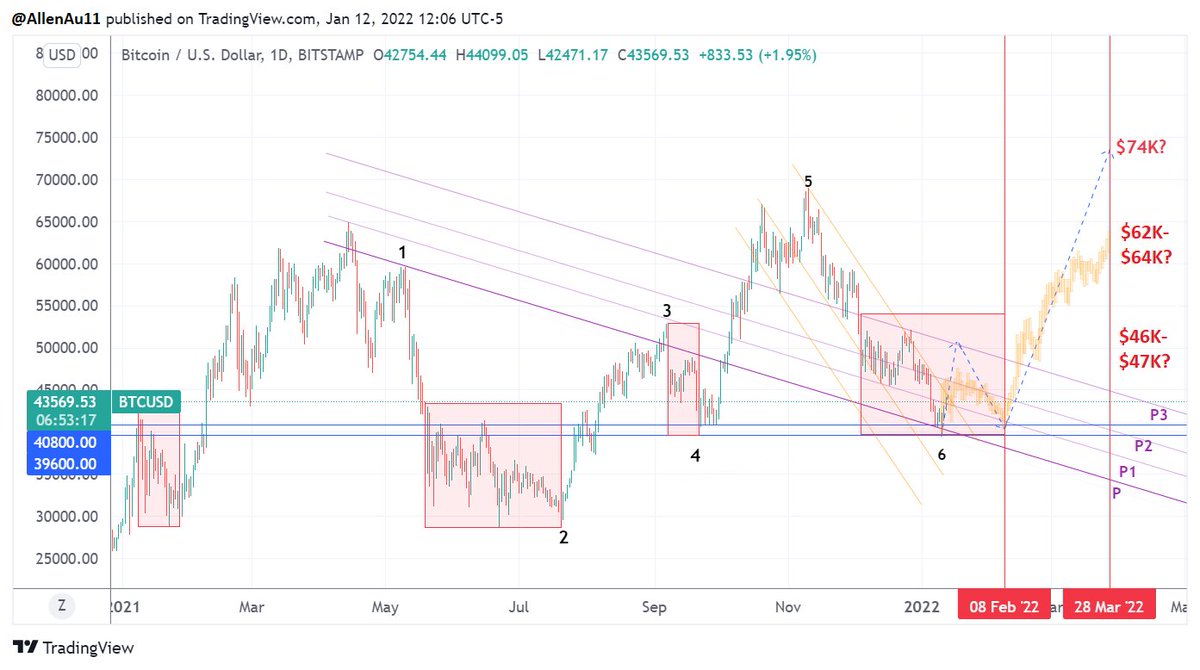 1a/ Parallel channel breakout
 1a/This model (LGC) is constructed on Tradingview with #BTC log growth curves developed by @quantadelic with log Fib levels & time-based Fib zones added on a 2-week BTC chart. This is similar to TechDev’s chart, but the cycle peak log Fib level is at 2.618 & not 2.272.
 1a/ #BTC's price has been highly correlated with US10Y & they had moved in lock-steps since 11/8/21 until last week. Traders risked off ahead of the Fed minutes & sold stocks & BTC.
 TLDR (Cont...)
 1/ Cycles of long-term (LT) HODL waves (those who HODL #BTC for >=6 mo.) have always co-existed with the 4-year halving driven cycle & have been driving BTC’s price action.
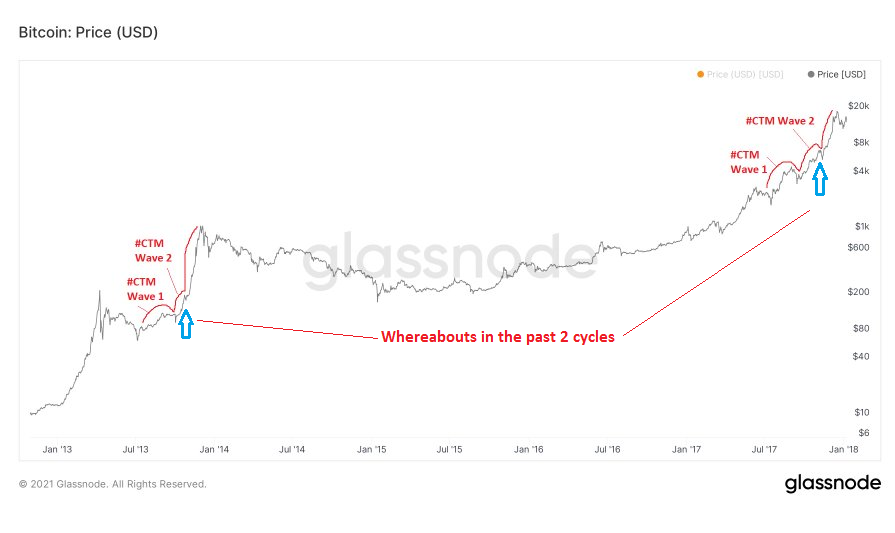
  Where is #BTC currently at in its bull phase?
 Where is #BTC currently at in its bull phase?
 Where is #BTC in the its bull phase?
 1/ On-chain

 1. #BTC didn't reach its bull flag price target of $71K. As it broke Trend Line A, Wave 5 Peak (#CTM Wave 2 peak) is in.
 Notes:

 The missing #BTC on-chain peak indicators🧵👇
 𝟭 𝗕𝘂𝗹𝗹 𝗣𝗵𝗮𝘀𝗲 𝗧𝗼𝗽 & 𝗕𝗲𝗮𝗿 𝗣𝗵𝗮𝘀𝗲 𝗕𝗼𝘁𝘁𝗼𝗺
 1a/ It is found that in each cycle around this time of the year, #BTC price will form two adjoined arcs similar to a cup & handle pattern.
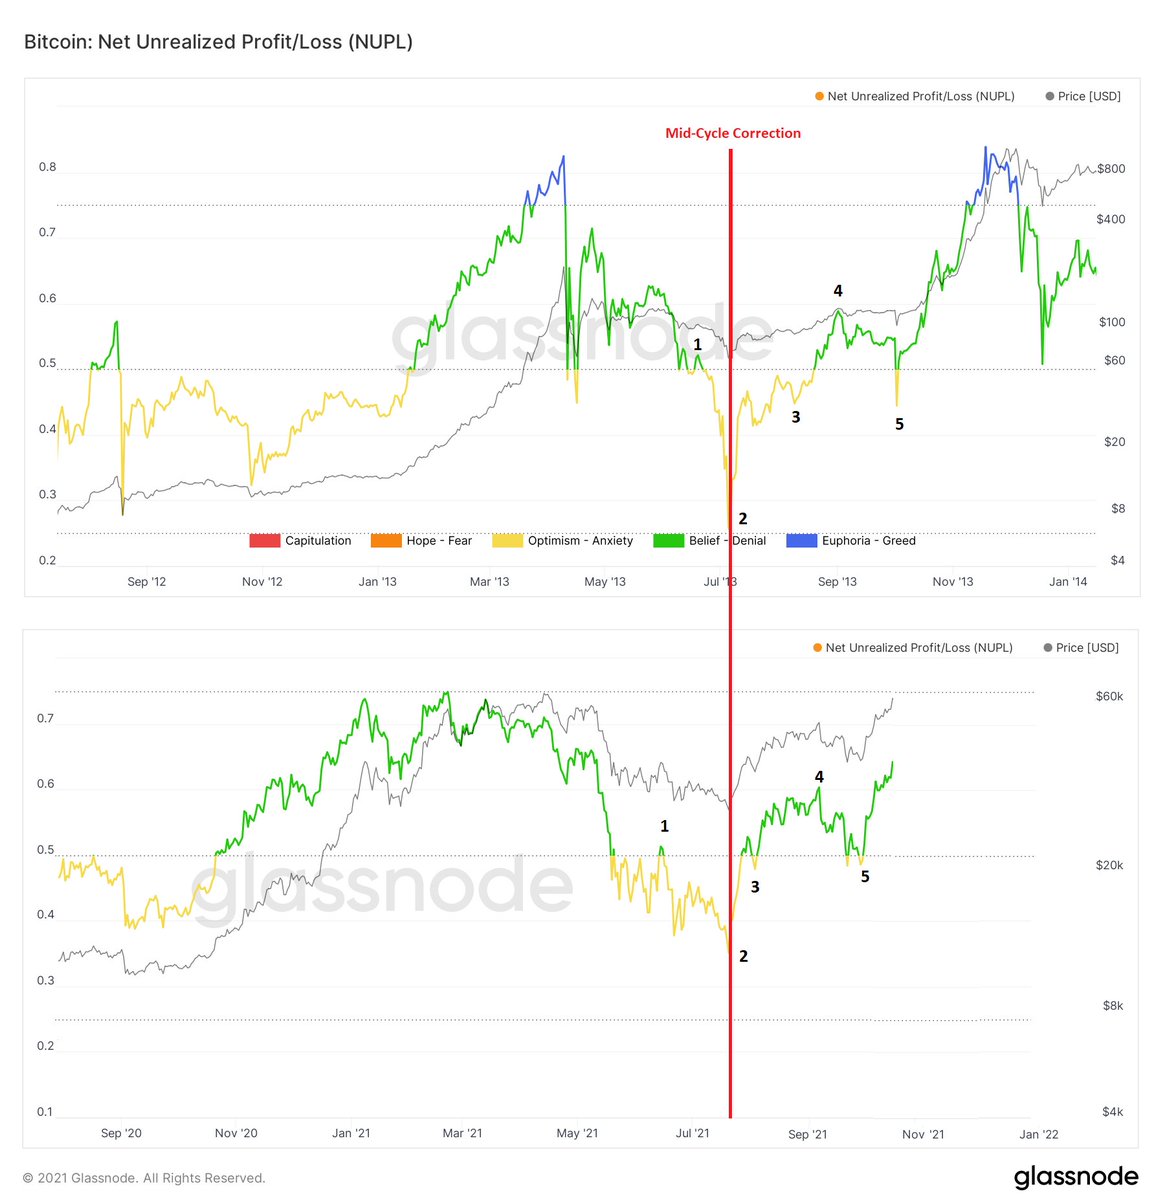 1/ #BTC's NUPL is the difference between Relative Unrealized Profit and Relative Unrealized Loss. This metric is calculated by subtracting realized cap from market cap, and dividing the result by the market cap. It is a measure of BTC's market sentiment.
 𝟭 𝗕𝘂𝗹𝗹 𝗣𝗵𝗮𝘀𝗲 𝗧𝗼𝗽 & 𝗕𝗲𝗮𝗿 𝗣𝗵𝗮𝘀𝗲 𝗕𝗼𝘁𝘁𝗼𝗺