A thread about transitory vs persistent inflation and why persistent might be actually be winning.
This comes from @economics And it breaks down CPI by reopening and non-reopening components.
Of the 5.25% inflation rate in the last year, only 1.62% was reopening components.
1/6
Breaking it down for August we find that reopening CPI components (or transitory inflation) FELL by 0.22% while CPI non-reopening components (or persistent inflation) ROSE by 0.35%
2/6
Detailing this we find that CPI non-reopening (persistent) components are surging to its highest monthly level since at least 2016.
Restated, this series of persistent inflation is trending higher, and is 78% of overall CPI.
3/6
The CPI reopening components (transitory) fell by the most since the lockdown.
Restated, this series of transitory inflation is falling and is just 14% of overall CPI.
4/6
So, why are the CPI reopening components falling? Is the Delta variant hurting the economy and sapping demand?
Consider these two charts.
Airline ticket prices collapsed by 9% annualized in August. Why? Because demand is also collapsing as measured by the TSA?
5/6
In sum transitory components are falling and their demand is off as Delta is hurting economic activity.
Meanwhile persistent inflation components are surging higher and higher.
Is this why stocks turnaround today? Weakening demand and higher inflation squeezing margins?
6/6
• • •
Missing some Tweet in this thread? You can try to
force a refresh
Maybe this chart is making Manchin worry about blindly following the leader of his party.
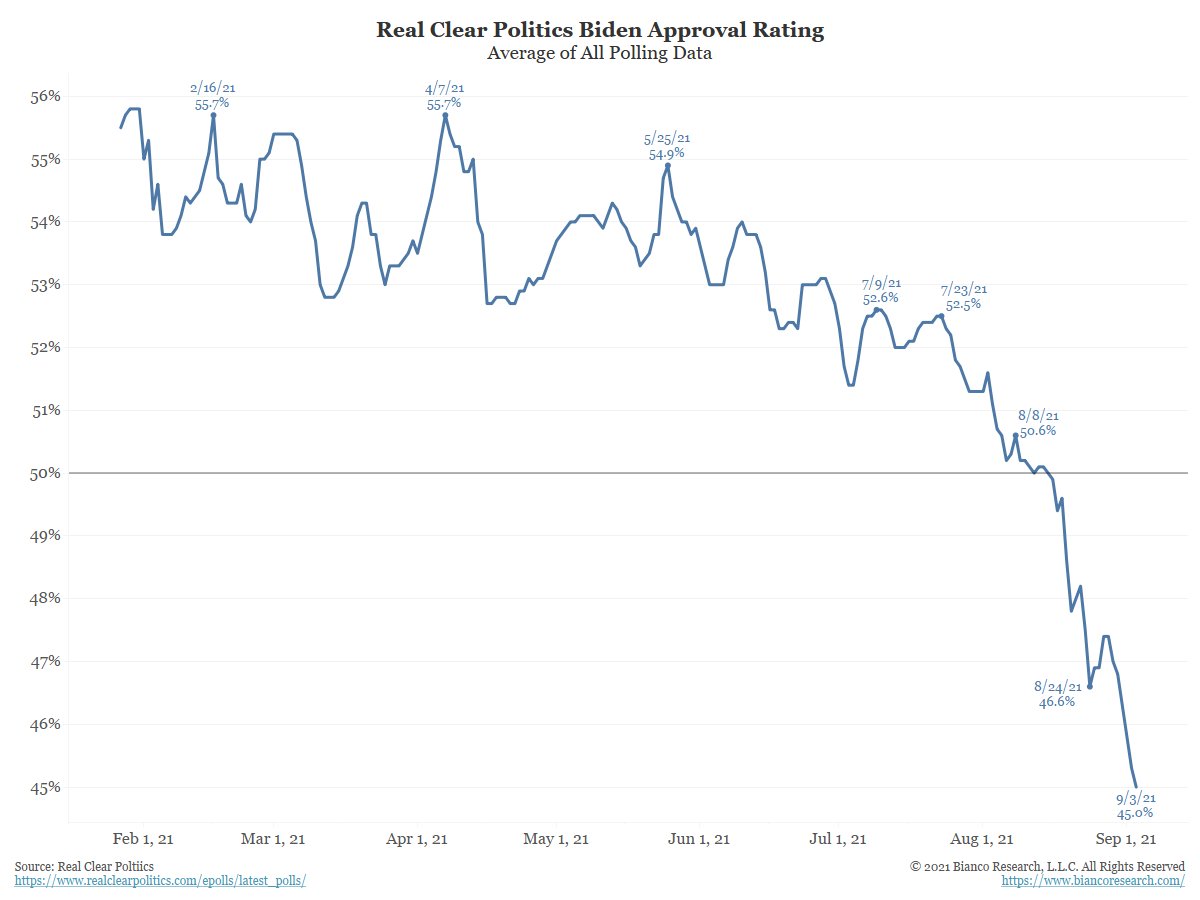
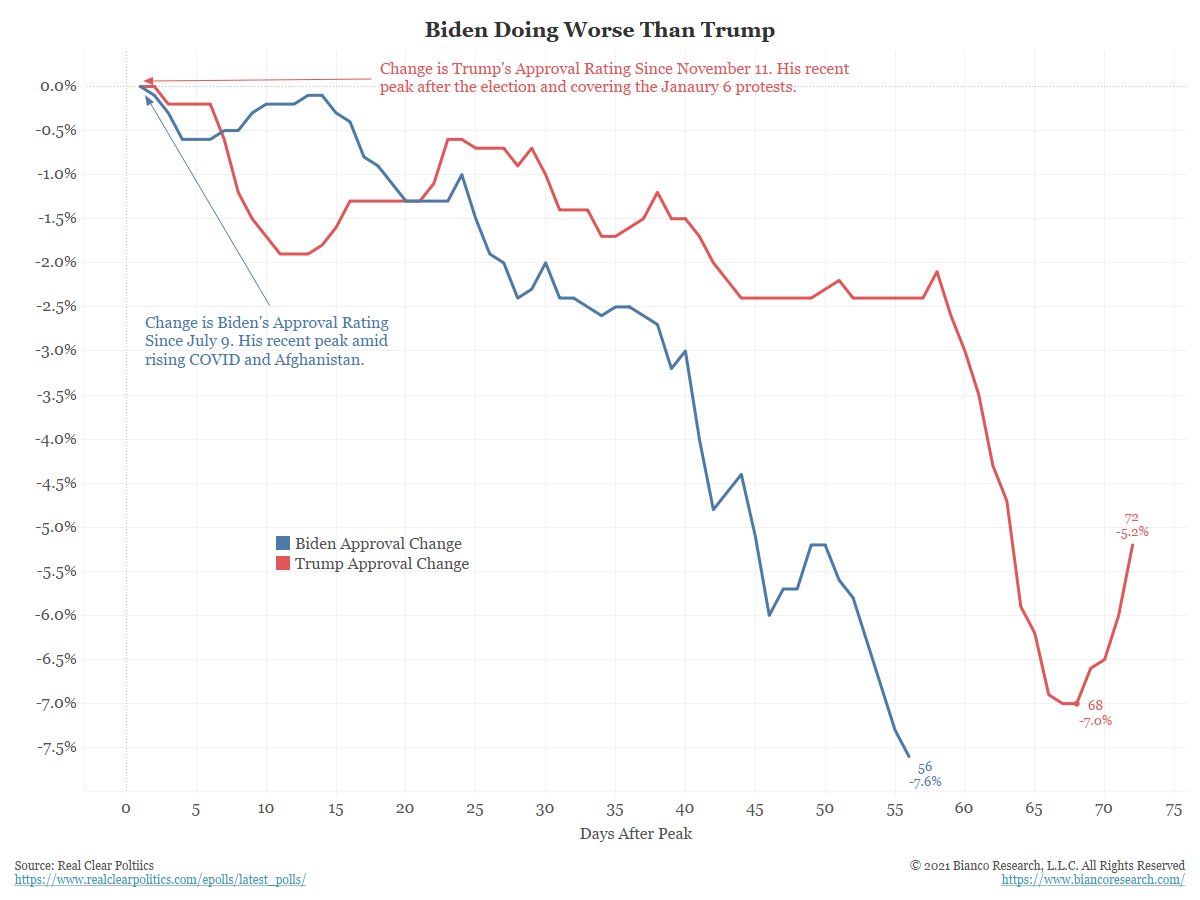
Recall that we are a very polarized country. The vast majority of the country will NEVER change its opinion about a President (for or against). So this is a big move.
2/5
How bad is this for Biden. This chart shows Biden's approval rating decline since July 9 (his recent peak) after the COVID turned higher and Afghanistan vs Trump's Nov 11 peak, after the Election and the Jan 6th protest.
Worth noting that this is the Fed's fourth tapering attempt in the last 13 years. 1/3
All tapers end when the economy weakens (2012 leading to Operation Twist) or markets turn wobbly (19% SPX correct after they tapered QE1 in 2010 and the repo market blowing up in September 2019, after tapering QE3).
2/3
View this as a cyclical move. The Fed will turn on the printing press again should circumstances demand it.
So, markets have no reason to crash on the removal of accommodation because it is never gone for good.
3/3
Bottom line, companies have delivered earnings like a .300+ hitter with 35+ hrs. But you're paying that hitter $35m+/yr (record salary). Good for now. But will this hitter earn its pay next year, and the year after?
1/8
As of August 23, 2021, 475 (95%) S&P 500 companies have reported Q2 2021 earnings with a beat rate of 87%, a new record. This compares to an average beat rate of 71% since the Great Recession ended.
2/8
Analysts expected YoY earnings of ~55%. The latest blended est. is ~ 95%. This jump of ~40% is record.
YoY earnings is compared to Q2 20220, the worst point of the lockdown, big base effect. This is why estimates for Q3 2021 earnings growth drop to 29% and 20% for Q4 2021.
This chart shows the SPX (red) between the overnight gains (orange) and the day session gains (blue).
Between Jun-1, 20 and Mar-11, 21, all the gains came overnight (open - prev close) and now the gains come during the day session (close-open).
This flipped on March 11th.
1/3
So what happened on or around March 11th? One thing I can find is the reopening stocks peaked on March 15th and have been terrible performers.
2/3
This graphically shows a pattern that is getting noticed more and more. That is, ES Fut are weak overnight and they rally back during the day session. Prior to March 11th, this was the opposite. And March 11th, was the effective peak of reopening stocks.
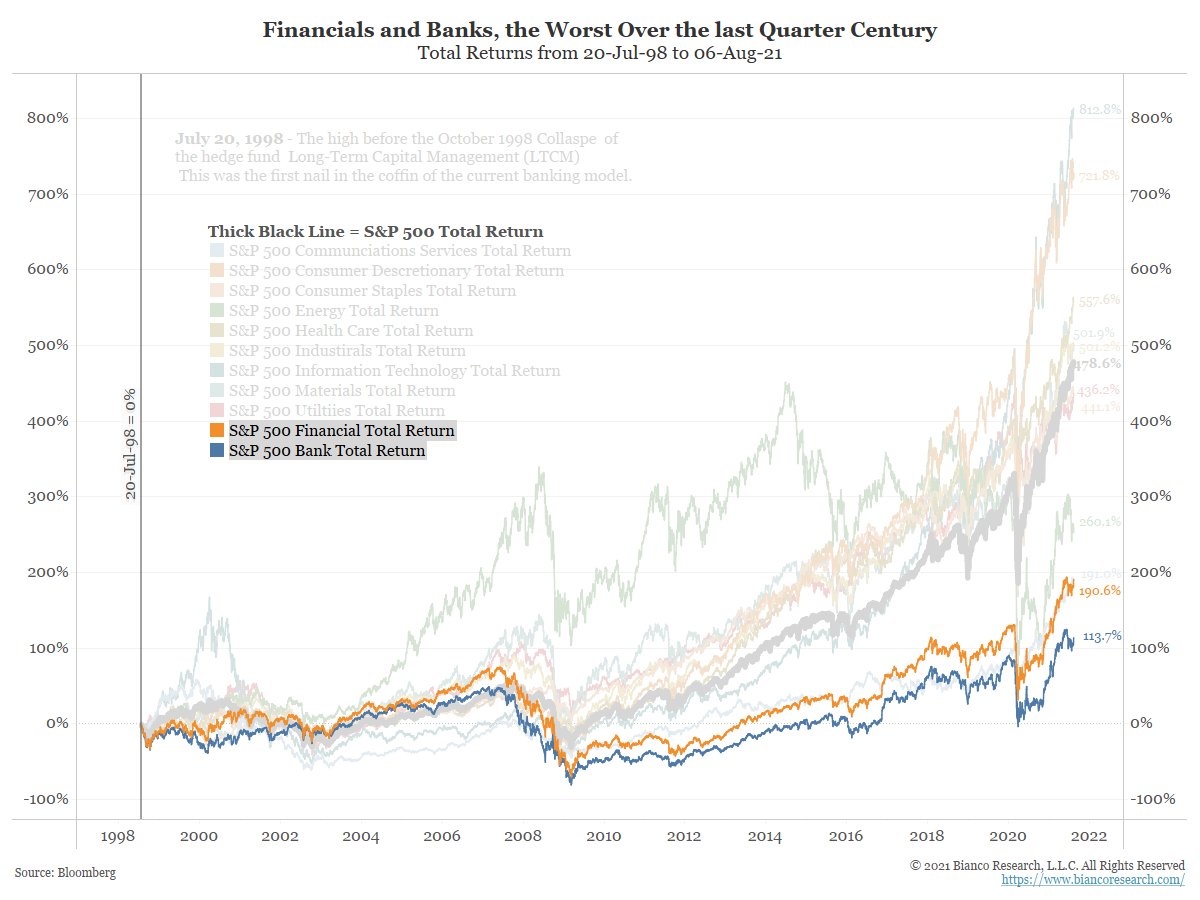
Same chart as above since the Global Financial Crisis in 2008.
Again financials and banks are the worst possible investments. But now energy (green), after its epic collapse the last few years, joins the bottom of the return list.
The big office in a city center is a broken model. The pushback to return is palpable.
Instead of bribing people in a desperate attempt to return to 2019, time to think forward about what the future of the office is and what purpose it still serves.
The future of work? Look at how the gaming industry has evolved. That community has managed to develop relationships, improve productivity, train each other, and reward each other without ever sitting in the same room.
This could serve as a roadmap for the larger workforce.
What is most office jobs in 2021? You sit in front of a computer manipulating things on a screen. This describes about 30% of jobs, and virtually every job in financial services.
This is what gamers do, and they are more advanced at “remote work” than the typical company.