
officially over 1,000 responses to my survey of Lutherans, and over 200 for my broader survey of religion. For all Facebook ads, mass mailing, everything, by the time it's all said and done, I'll have spent ~$2,000, meaning my cost per response is going to be $1.70 or less.
which is hilarious since I was quoted $95/response by a major firm and lots of people told me that was actually not crazy.
now of course my sample isn't random!
but when you're sampling a group which is <1% of the population to begin with via an online sample, *that's not a random sample anyways*
but when you're sampling a group which is <1% of the population to begin with via an online sample, *that's not a random sample anyways*
obviously, no matter what, gonna need creative weights and careful consideration of what analyses work
Also, we should really consider doing an LCMS physical-site survey. Hiring people to drop in on every LCMS site of worship on 3 occasions and log basic descriptive demographic data and some church characteristics around worship style would *only* cost about $1.6 million.
In principle you don't even need synod's approval for this. The addresses are public. You just buy a crapton of cloud space, TaskRabbit people to go to church and record the service, photograph the bulletin, ask 2 or 3 questions of a pastor, and report apparent age/sex of...
... like the first 20 people they see or whatever.
Then you taskrabbit a few people to *watch* to recordings, and categorize them on a few salient features.
Then you taskrabbit a few people to *watch* to recordings, and categorize them on a few salient features.
Costing out the hourlies and overhead on this, I really think $1.6 mil is a good cost estimate, and absolutely no more than $2.5 mil.
This is assuming ~7,500 worship sites, 3 visits per site, 4 hours of labor per visit (2 hrs attending, 2 hrs listening), and $200,000 in other overhead.
If instead you want 4 visits/site and 6 hrs labor each, and $500k overhead, it's $3.2 mil.
If instead you want 4 visits/site and 6 hrs labor each, and $500k overhead, it's $3.2 mil.
The reason to do more visits/site is of course to check reliability of your person visiting in terms of their descriptions. 3 should be enough though.
tbh it kinda blows my mind that large denominations do not *already* do something like this every 20 years or so!
please, someone give me millions in grant money to do this
https://twitter.com/TaupeAvenger/status/1438535288846893062
anyways, for today's sad-LCMS-stat...
officially reported attendance at LCMS Sunday Schools by kids age 2-5 has never amounted to more than 25% of the sum of baptisms which occurred 2-5 years prior in data appearing in Lutheran annuals.
officially reported attendance at LCMS Sunday Schools by kids age 2-5 has never amounted to more than 25% of the sum of baptisms which occurred 2-5 years prior in data appearing in Lutheran annuals.
doubtless a lot of this is that churches simply don't report their children's programs officially.... but OTOH adult Sunday School classes reported in the same forms by the same churches look plausibly sized: about 18% of church attenders attend adult Sunday school.
Which, based on churches I've been in, it seems plausible to me that about 1/5 of the people present might go to the adult class before/after church on average. Some churches it's way higher, some it's way lower, some churches don't even have such a class.
worth mentioning that since 1995, adult sunday school as a % of communicant membership has been just about totally stable. That's actually really interesting as a behavioral thing!
people always think changes are what is most interesting; but *stability* of an indicator among big changes around it can be just as interesting!
in fact using a model-based estimate calibrated to lagged baptisms and age-unspecific sunday school attendance, it looks like adult Sunday School attendance rates as a % of communicant members have been completely unchanged **since 1969**!
The data I have on LCMS deaths is pretty noisy but when I adjust for the likely problems in it, I find that LCMS deaths outnumbered LCMS youth confirmations around 2000 and have ever since, and they outnumbered infant baptisms around 2011-2017 sometime.
tbh these are both kinda later than I expected. And the implication is that the LCMS had *positive* adult conversions as late as 1996, and did not turn seriously negative until sometime between 2003 and 2008!
Which means the LCMS in the 1990s was probably growing through both natural fertility increase as well as conversion. It really was not all that long ago people! We aren't talking about the impossible here!
Anyways, here's what I think the components of LCMS church membership change look like as far back as I can take them. 
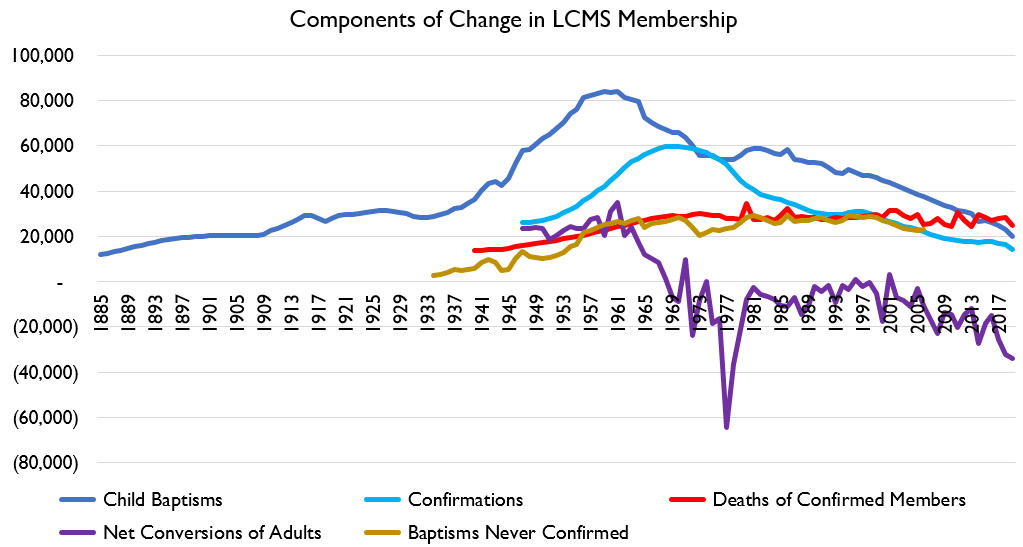
A key takeaway here is that "deaths of members," "adults leaving the church," and "baptized babies never getting confirmed" are all about equally-sized in terms of their effects on church membership change.
imagine if actually evangelism and babies are not opposites but actually we are absolutely hemorrhaging on both
so that was the optimistic take.
the pessimistic take is: assuming we make zero improvement on anything else, to offset current rates of retention of kids and adult conversions, the average LCMS women would need to have on average 17 children for the church to grow.
the pessimistic take is: assuming we make zero improvement on anything else, to offset current rates of retention of kids and adult conversions, the average LCMS women would need to have on average 17 children for the church to grow.
since we only retain about 40% of LCMS-born kids and we lose about 2.3% of adult members via conversion *every year* these days, the fertility you'd need to keep the doors open just via births is literally a biological impossibility.
on the other hand, at current retention and fertility rates, for the church to grow via conversion would require 62,000 extra *net* conversions per year.
we currently average ~14,000 adult confirmations per year, and we have *never* gotten more than 32,000.
we currently average ~14,000 adult confirmations per year, and we have *never* gotten more than 32,000.
so we would need to have literally 5 times as much/effective evangelism.
now look i'm not saying that's *impossible* but i'll go on record saying it's *improbable*
now look i'm not saying that's *impossible* but i'll go on record saying it's *improbable*
and of course even with 100% youth retention the church would still rapidly decline because 1) not that many youth are born and 2) a lot of them leave as adults
so the two ways to look at this is we are absolutely ruined and there's no hope
or
gotta walk AND chew gum
or
gotta walk AND chew gum
put another way:
if we can get confirmations back up to 80% of baptisms (where they were in 1969; before that they were even higher, sometimes >90%)...
... and family size at 3 kids...
... and just get conversions to *breakeven* (+33,000 more adults)....
we grow again!
if we can get confirmations back up to 80% of baptisms (where they were in 1969; before that they were even higher, sometimes >90%)...
... and family size at 3 kids...
... and just get conversions to *breakeven* (+33,000 more adults)....
we grow again!
these changes are all ambitious, but they are all things that the LCMS has in fact actually done at various points in its past and they are all at least *possible*
sorry, small error: need a TFR of 2.5, not 3. misread which column I was grabbing.
so if by 2040 we are at 80% retention, 2.5 TFR, and breakeven conversions, the church will be growing, even though there will be an avalanche of dying Boomers absolutely wrecking baseline growth numbers.
20 years to make it happen everybody
(note that if we assume LCMS people have US-standard marriage behavior, the average *married* household would need to have about 3-3.5 kids on average)
(so to hit the 2.5 average for the church, you probably need something like a social norm of 4 children for families)
• • •
Missing some Tweet in this thread? You can try to
force a refresh


