Pinned index post linking to a simple table of contents page to make it easier to find my normal daily posts.
As interest in this content is reducing, some threads may not be posted to twitter every day but will still be available via index page.
…ddatashare.s3-eu-west-1.amazonaws.com/index.html
As interest in this content is reducing, some threads may not be posted to twitter every day but will still be available via index page.
…ddatashare.s3-eu-west-1.amazonaws.com/index.html
Vaccine: …ddatashare.s3-eu-west-1.amazonaws.com/Vac/Vac_202109…
Deaths:
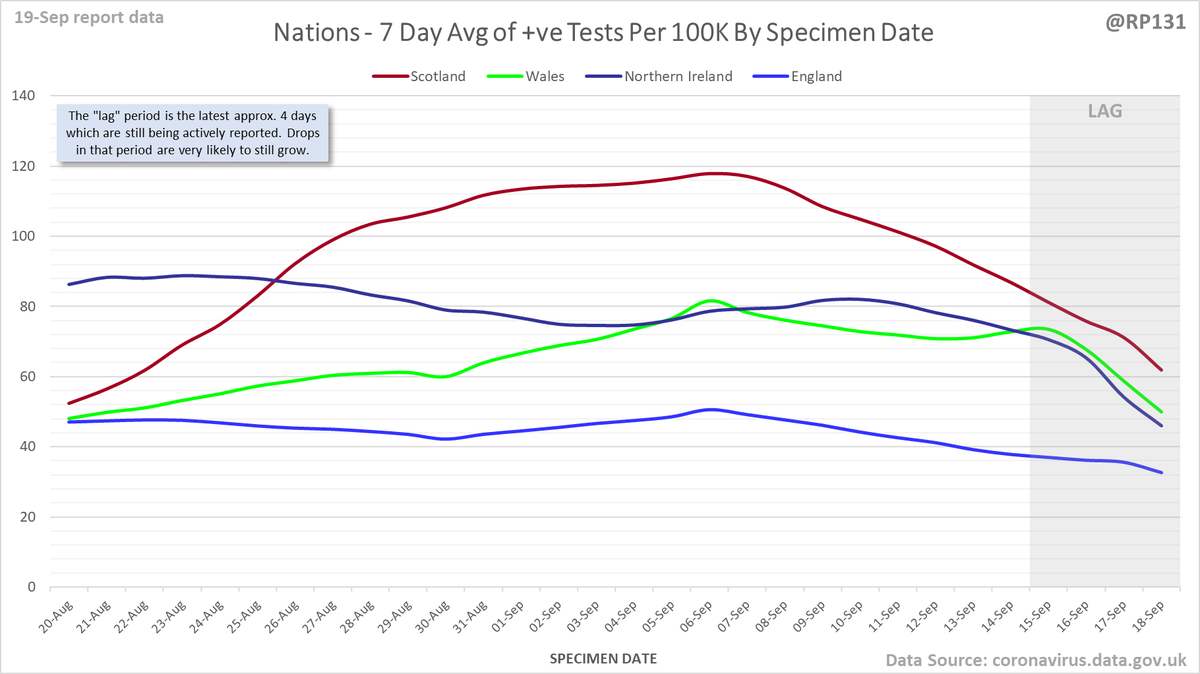
Nation: …ddatashare.s3-eu-west-1.amazonaws.com/Nation/Nation_…
Table:
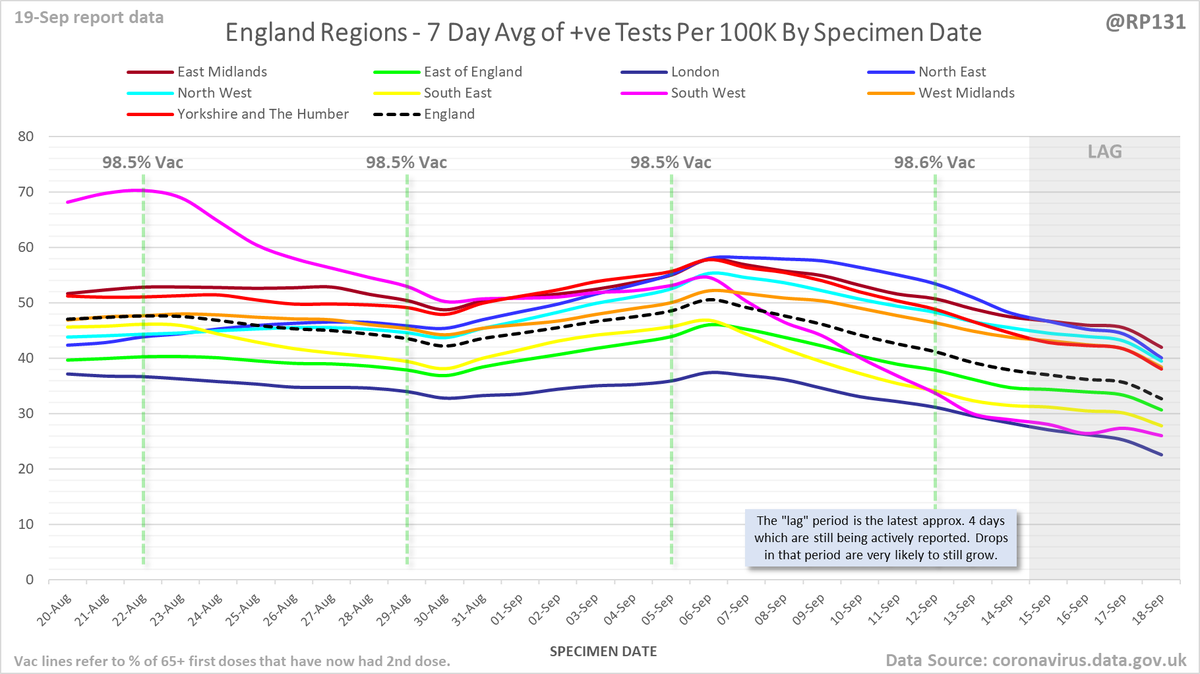
Detail:
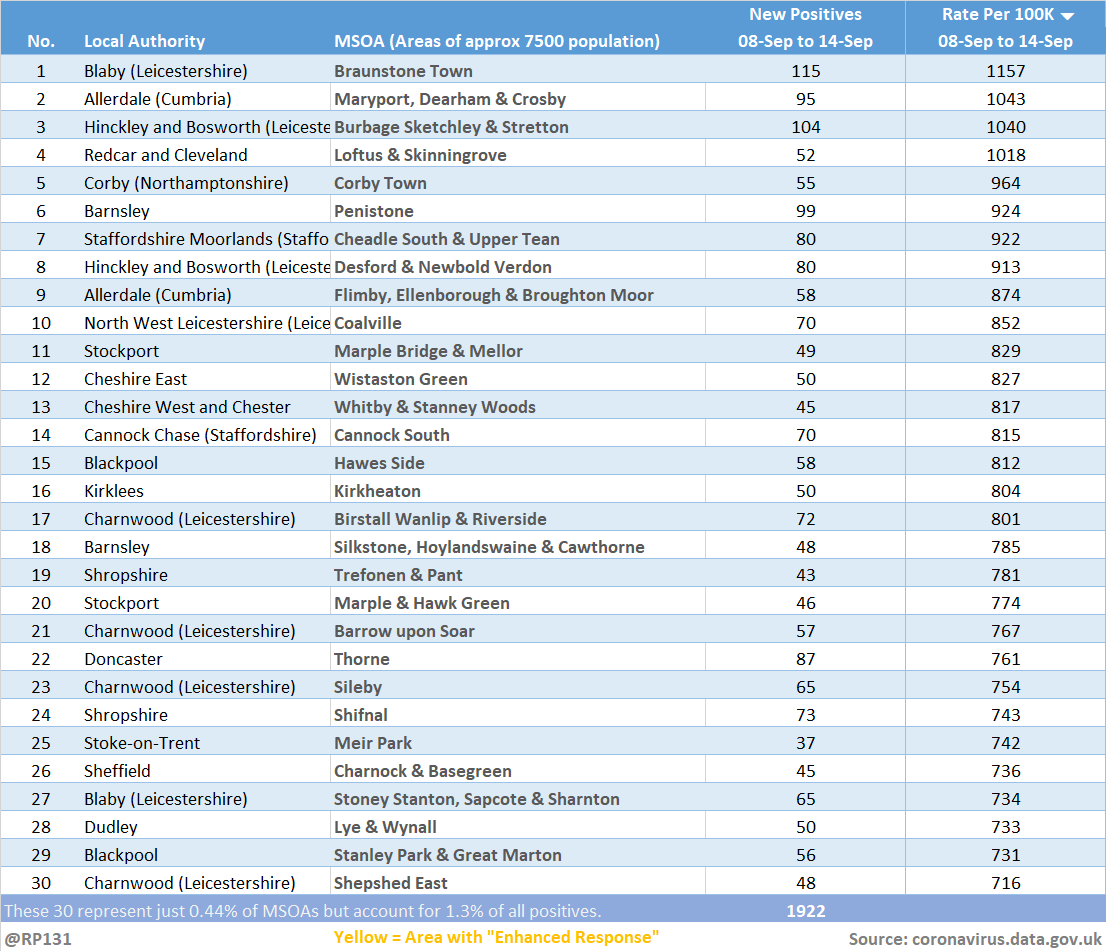
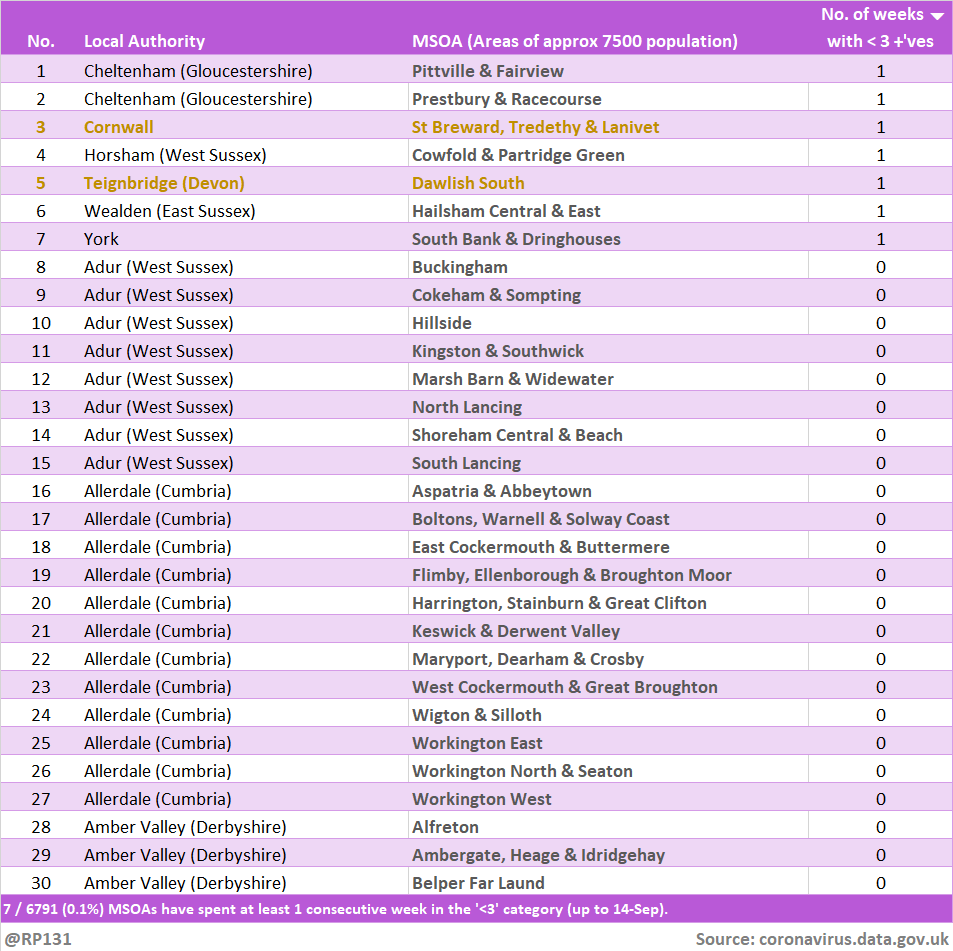
MSOA:
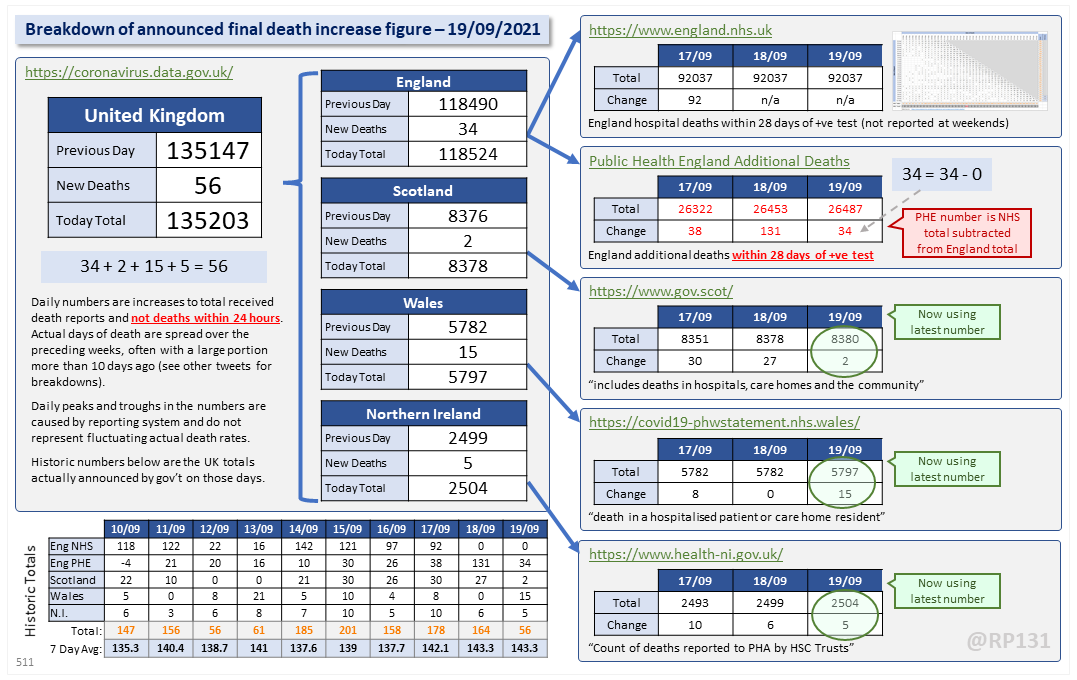
Deaths:
https://twitter.com/RP131/status/1439284058396188673
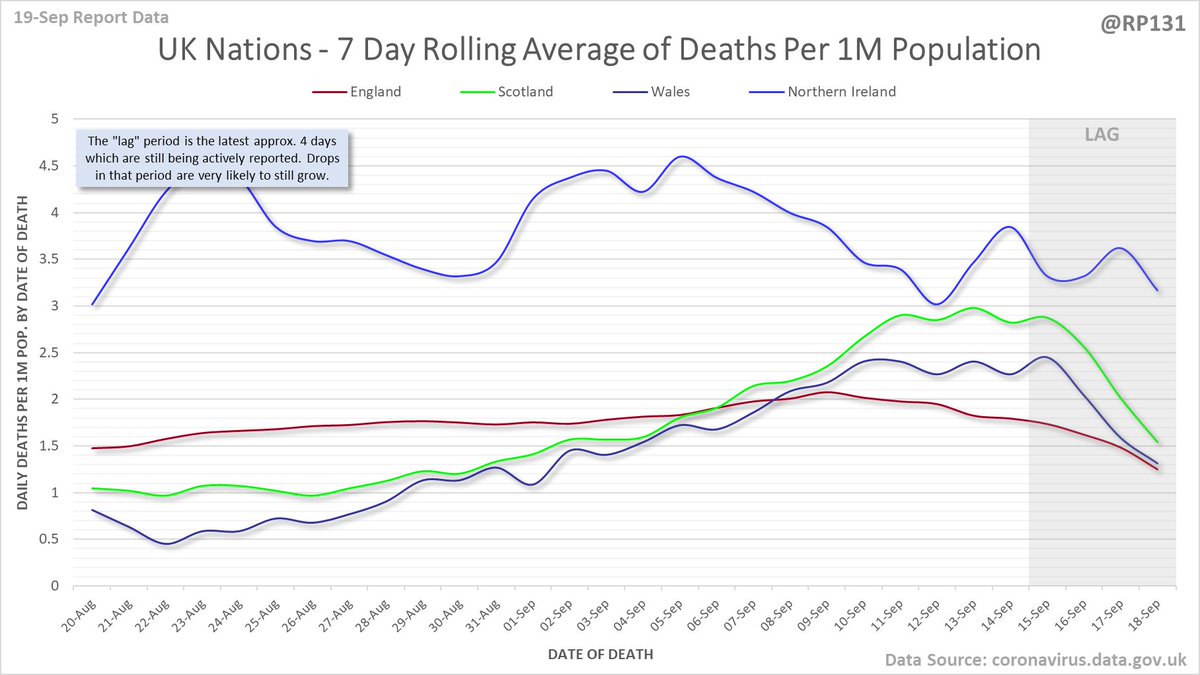
Nation: …ddatashare.s3-eu-west-1.amazonaws.com/Nation/Nation_…
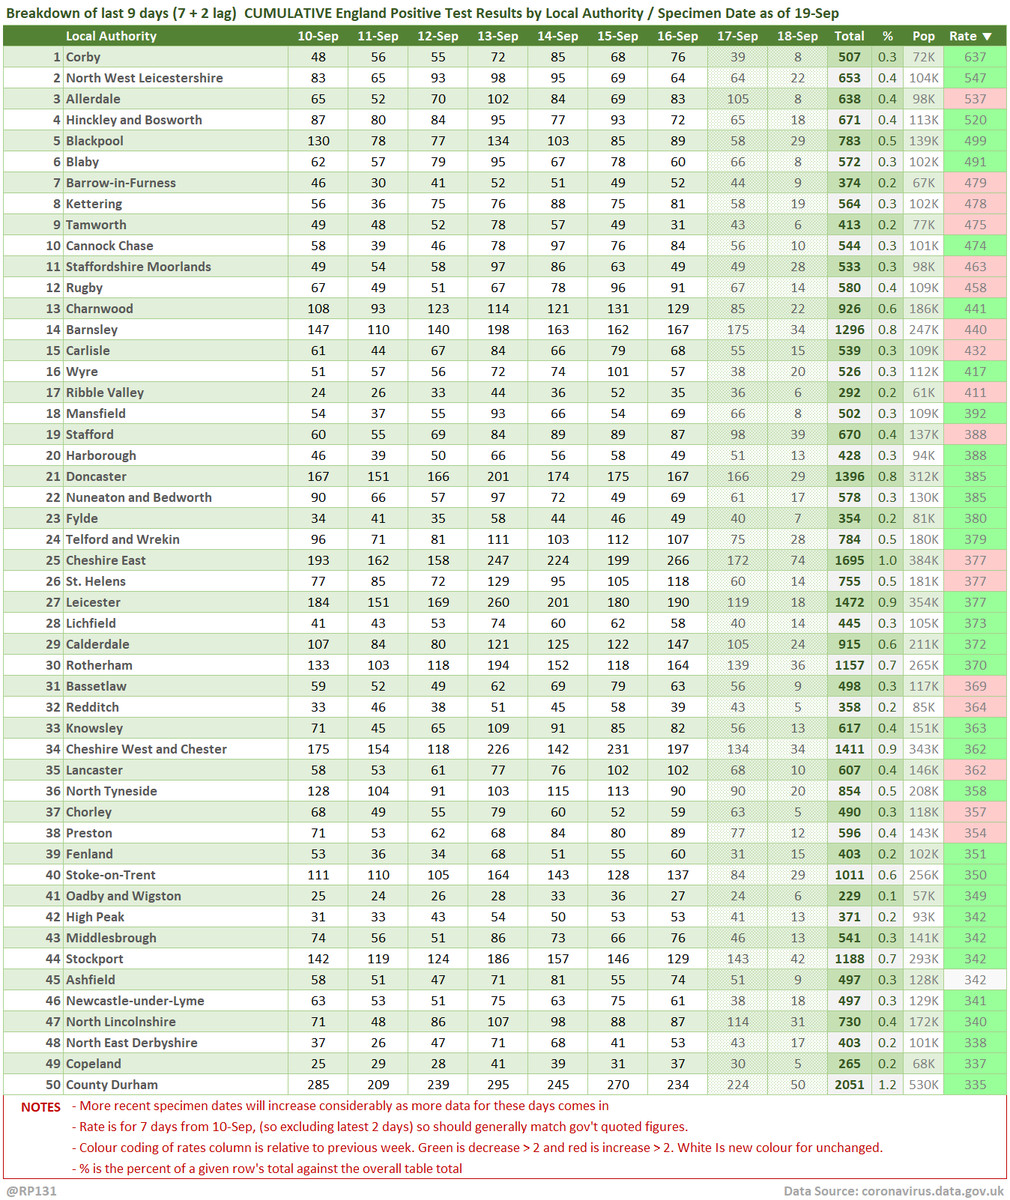
Table:
https://twitter.com/RP131/status/1439285389940957185
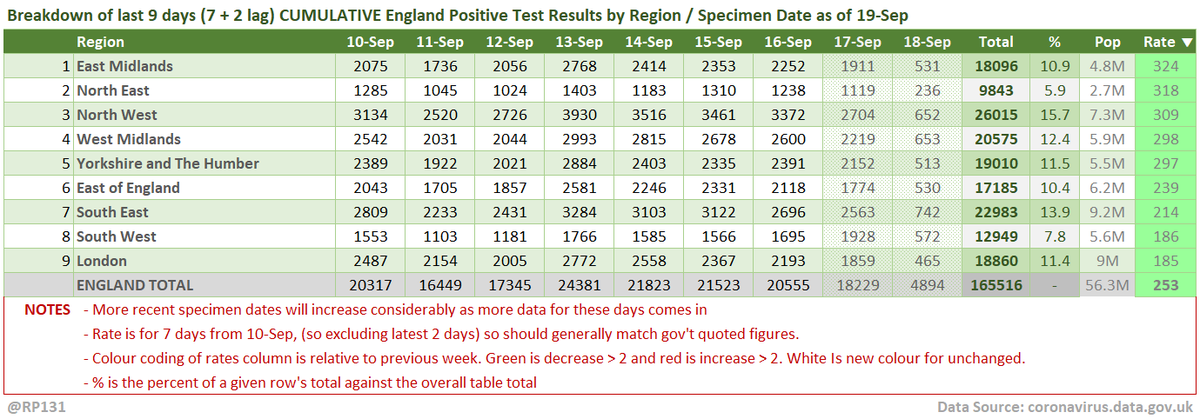
Detail:
https://twitter.com/RP131/status/1439286716720951302
MSOA:
https://twitter.com/RP131/status/1439288057954504715
https://twitter.com/RP131/status/1439284058396188673
Hospital data: Not updated today
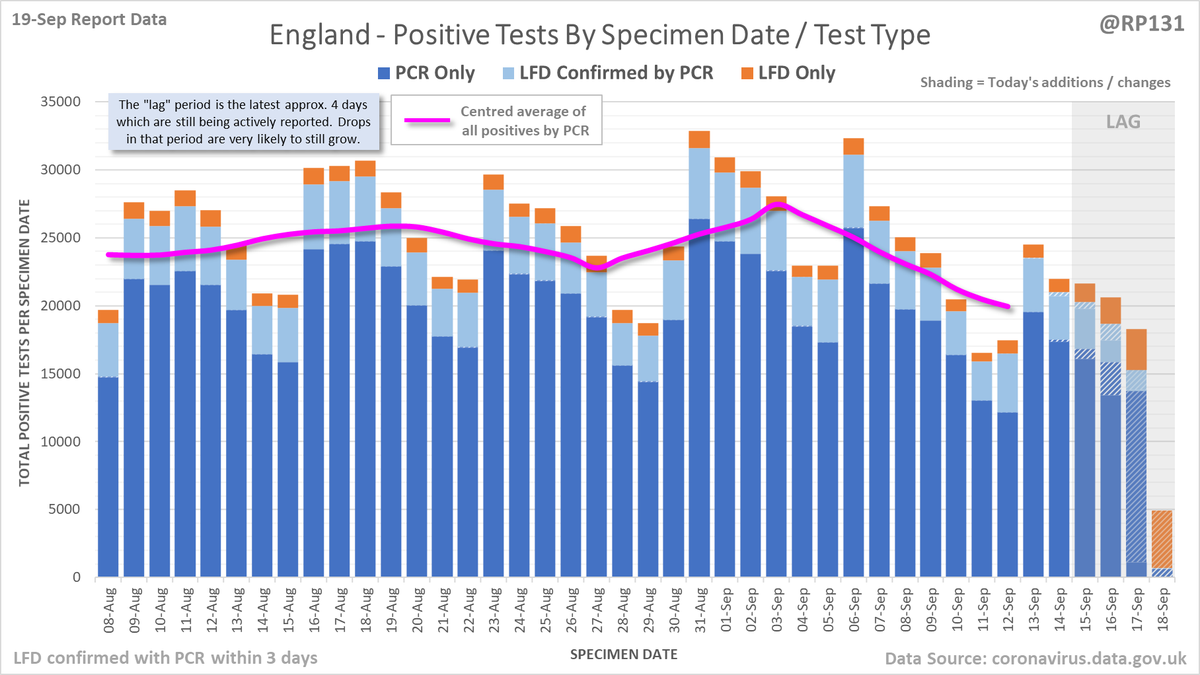
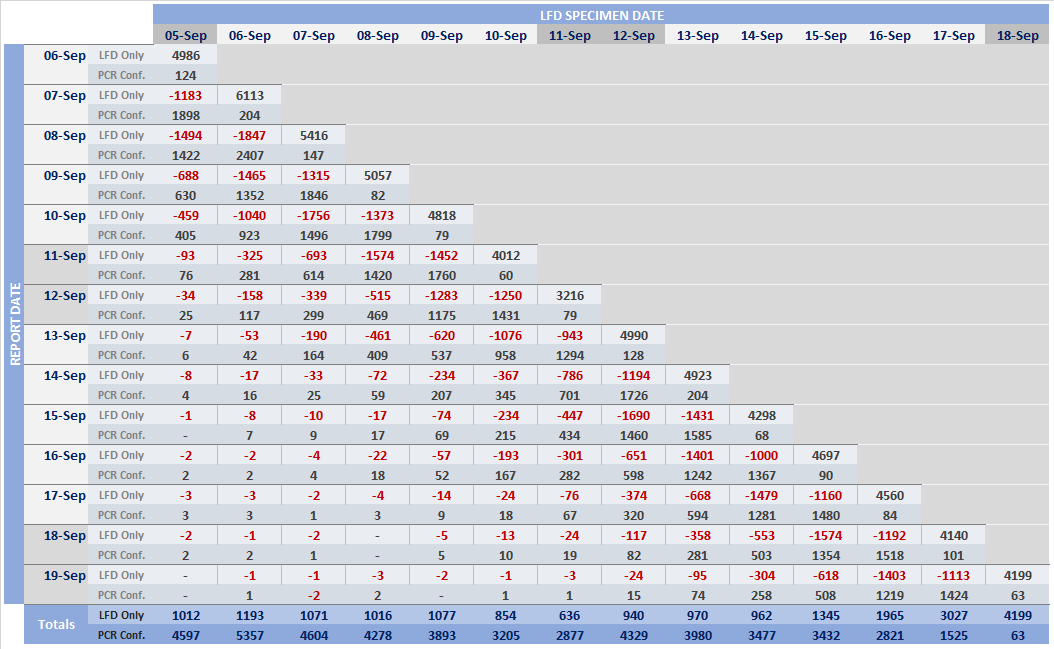
Positives test additions:
Death additions: …ddatashare.s3-eu-west-1.amazonaws.com/AdditionDeath/…
Bubble: …ddatashare.s3-eu-west-1.amazonaws.com/Bubble/Bubble_…
Delay: Not updated today
Mirror: Not updated today
Positives test additions:
https://twitter.com/RP131/status/1439282697541668864
Death additions: …ddatashare.s3-eu-west-1.amazonaws.com/AdditionDeath/…
Bubble: …ddatashare.s3-eu-west-1.amazonaws.com/Bubble/Bubble_…
Delay: Not updated today
Mirror: Not updated today
https://twitter.com/RP131/status/1439282697541668864
My own work in this feed (usually indicated by the @rp131 watermark) is free for anyone to use however they wish. A link back to this account, or quote-tweet of the original will always be appreciated. And of course, there's still this:
buymeacoffee.com/rp131
buymeacoffee.com/rp131
• • •
Missing some Tweet in this thread? You can try to
force a refresh


