In 2013 the SEC ruled that any Govt sec that does not pay on maturity date is in technical default and must be valued at $0.
So, money market funds holding T-Bills maturing while in a debt ceiling fight, must market them at $0 until paid.
3/5
A money fund holding Bills marked at zero could "break the buck" which has often caused a crisis.
What does the mkt think? The Bill Curve tells us. The "kink" (red) shows where the market thinks is the risk of not getting paid. Late Oct to early Nov is the risk.
4/5
BUT! the kink is only a few basis points (bps). During the Obama debt ceiling fight (2013), this type of spread got to 30 or 40 bps.
So the small size of the "kink" says the market is not particularly concerned. The placement of the kink tells us when it will be an issue.
5/5
• • •
Missing some Tweet in this thread? You can try to
force a refresh
Gensler is a career bureaucrat, nothing more, nothing less.
That means he gets important positions of power and he gets to be in the room when the policy is formulated, and offer his opinion, and it will be seriously considered.
2/3
But when the policy is made (read: Yellen decides) Gensler is to prostitute to the full force of his office/reputation to sell it. And sell it like he means it!
Otherwise, they will find another bureaucrat and he can go back to MIT.
The democrats have the presidency and the majority in the House and the tie-breaking vote in the Senate (50/50, VP breaks ties).
They do not need a single republican vote to raise the debt ceiling.
2/6
So what is Yellen worrying about?
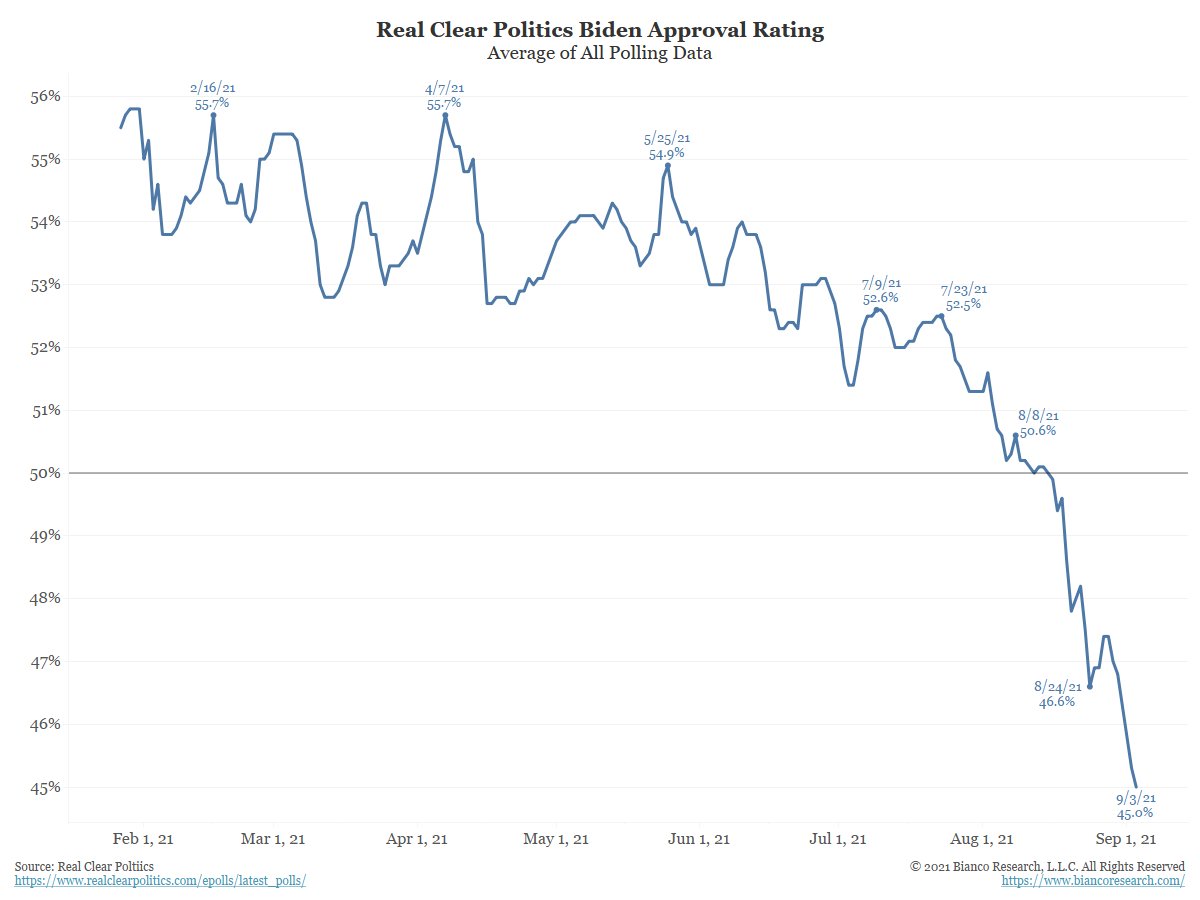
Could it be that Biden is losing political cloud?
As this chart shows, and I have mentioned in previous tweets, we are a very polarized country. No one ever changes their opinion (for or against). So a move of this size is significant. 3/6
A thread about transitory vs persistent inflation and why persistent might be actually be winning.
This comes from @economics And it breaks down CPI by reopening and non-reopening components.
Of the 5.25% inflation rate in the last year, only 1.62% was reopening components.
1/6
Breaking it down for August we find that reopening CPI components (or transitory inflation) FELL by 0.22% while CPI non-reopening components (or persistent inflation) ROSE by 0.35%
2/6
Detailing this we find that CPI non-reopening (persistent) components are surging to its highest monthly level since at least 2016.
Restated, this series of persistent inflation is trending higher, and is 78% of overall CPI.
Maybe this chart is making Manchin worry about blindly following the leader of his party.
Recall that we are a very polarized country. The vast majority of the country will NEVER change its opinion about a President (for or against). So this is a big move.
2/5
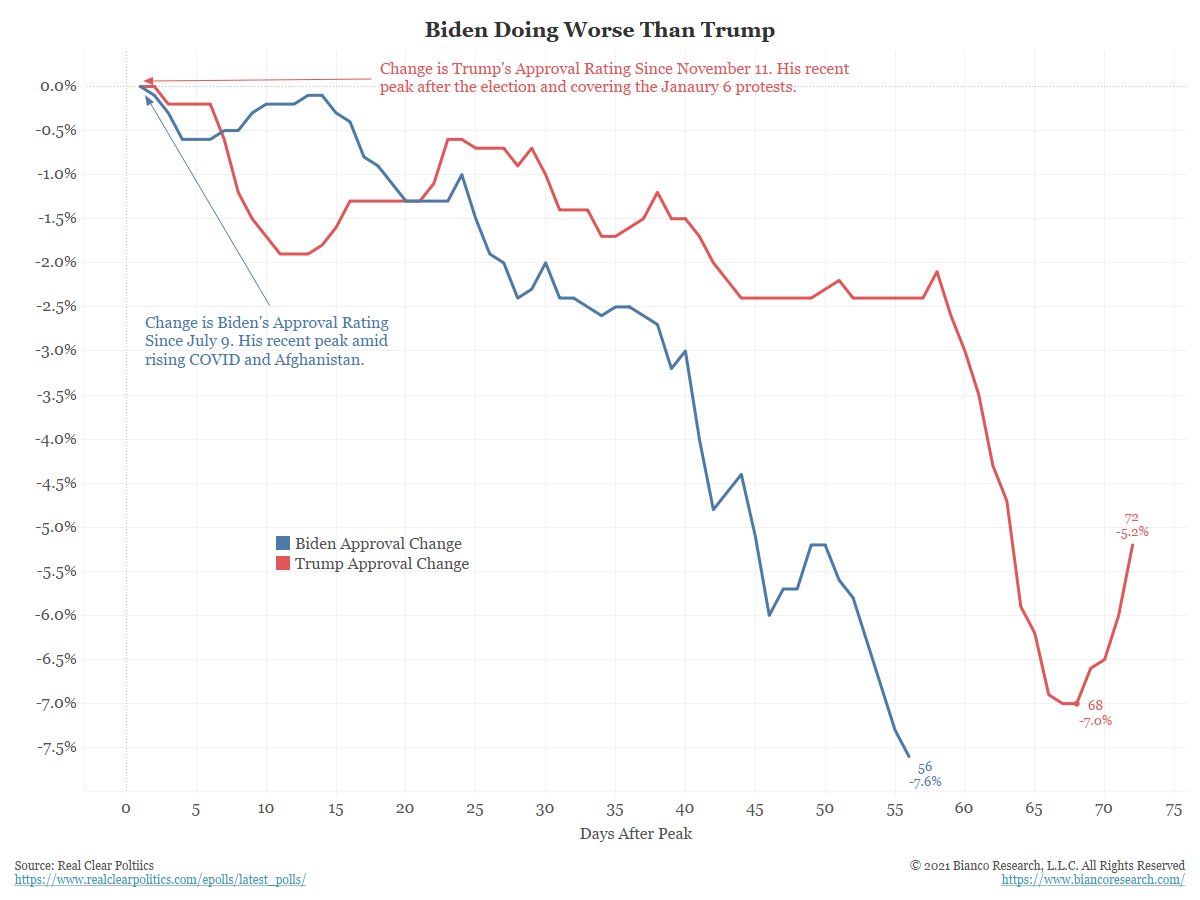
How bad is this for Biden. This chart shows Biden's approval rating decline since July 9 (his recent peak) after the COVID turned higher and Afghanistan vs Trump's Nov 11 peak, after the Election and the Jan 6th protest.
Worth noting that this is the Fed's fourth tapering attempt in the last 13 years. 1/3
All tapers end when the economy weakens (2012 leading to Operation Twist) or markets turn wobbly (19% SPX correct after they tapered QE1 in 2010 and the repo market blowing up in September 2019, after tapering QE3).
2/3
View this as a cyclical move. The Fed will turn on the printing press again should circumstances demand it.
So, markets have no reason to crash on the removal of accommodation because it is never gone for good.
3/3
Bottom line, companies have delivered earnings like a .300+ hitter with 35+ hrs. But you're paying that hitter $35m+/yr (record salary). Good for now. But will this hitter earn its pay next year, and the year after?
1/8
As of August 23, 2021, 475 (95%) S&P 500 companies have reported Q2 2021 earnings with a beat rate of 87%, a new record. This compares to an average beat rate of 71% since the Great Recession ended.
2/8
Analysts expected YoY earnings of ~55%. The latest blended est. is ~ 95%. This jump of ~40% is record.
YoY earnings is compared to Q2 20220, the worst point of the lockdown, big base effect. This is why estimates for Q3 2021 earnings growth drop to 29% and 20% for Q4 2021.