
Let's look at some data. 50% of the Irish population are day 60+. 10% day 120+. 4.3% day 180+. We currently have 13.5% of the population unvaccinated (including all 0-11yo). Consider medrxiv.org/content/10.110… even with is bias issues 
https://twitter.com/connolly_s/status/1440242913854701569


The 4.3% vaccinated for more than 180 days -best case- have the same viral load as the 13.5% unvaccinated. That leaves 5.7% on days 120-180 with a Ct increase of 0.3 which corresponds to a viral load reduction of 19%. Then 40% on days 60-120 Ct increase of 0.7 or 39% lower load
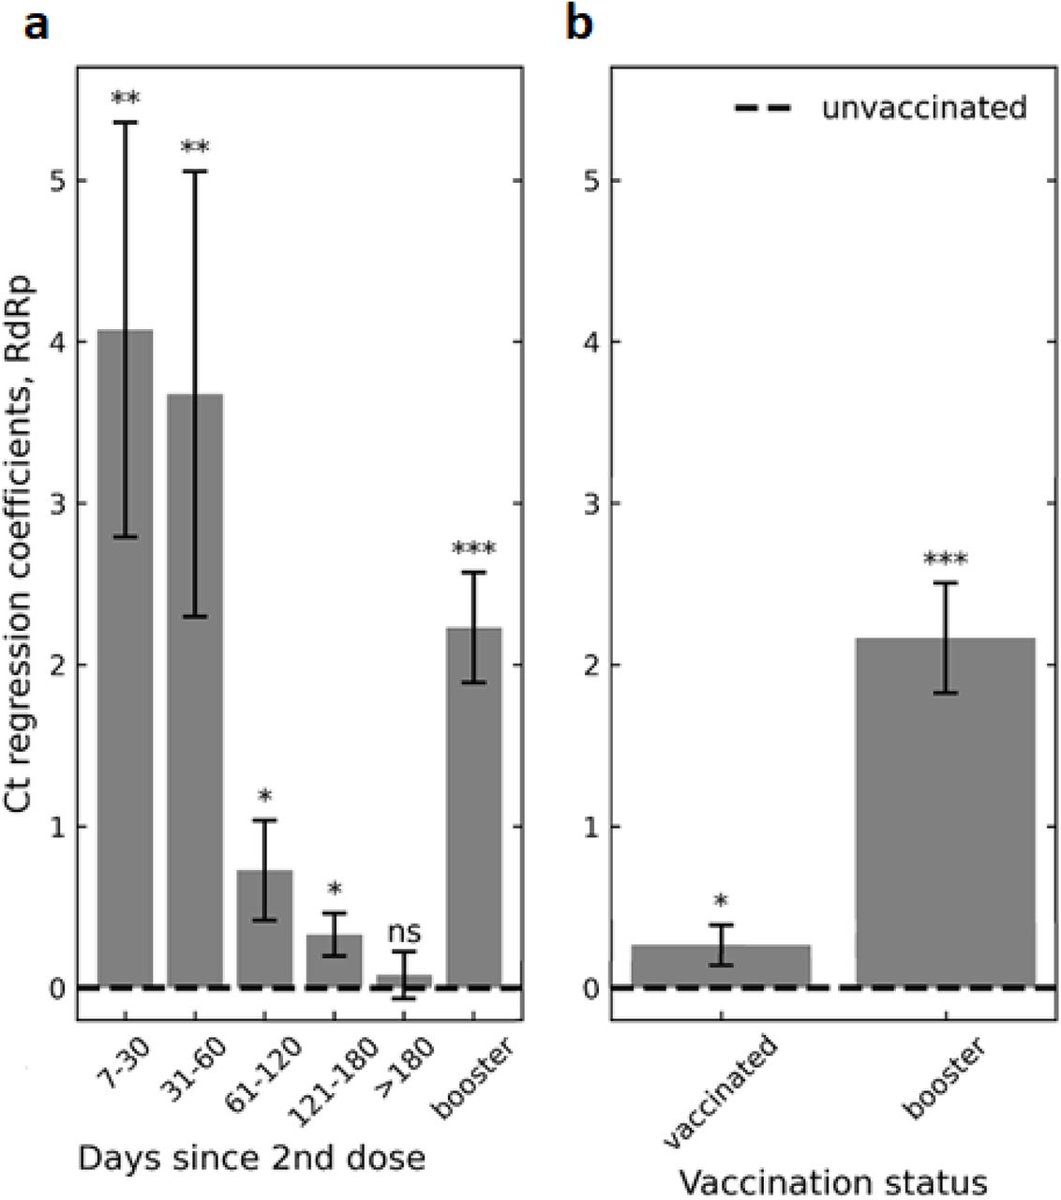
Take a group of 20 people chosen at random (including 0-11yo). About 3 will be unvaxed. 1 will be 180+ days (same risk as unvax), 1 will be 120-180 days (81% risk), 8 will be 60-120 days (61% risk) so the 60+ days fully vax represent (1+0.81+8*0.61)/3=2.2x risk of unvaxed
And that represents the lower limit. Because of the biases in the paper, the real risk from the vaccinated is actually likely to be higher. Also for office workers we need to exclude the 0-17yo which significantly reduces the proportion of unvaxed.
As people in Ireland return to the offices, if you fear getting infected (and your vax should mean you have not much to fear if you are infected... that's why you got the vax) you are at least twice as likely to be infected by one of your fellow vax office workers not the unvaxed
@threadreaderapp unroll
We can refine some more... 66% are day 30+ so that means 16% are days 30-60. They see a Ct change of 3.6 which is a whopping 91% lower load. There's 3 of them in our 20. Finally 73.5% on day 1+ full vax so that's 7.5% days 7-30 with a 93% lower load

So now the fully vaxed in total represent:
(1*1+1*0.81+8*0.61+3*0.09+1*0.07) = 7
In the group of 20 the 14 fully vaxed represent the same absolute risk as 7 unvaxed, yet there are only 3 unvaxed so you are 2.3 times as likely to get infected from fully vaxed person than unvaxed
(1*1+1*0.81+8*0.61+3*0.09+1*0.07) = 7
In the group of 20 the 14 fully vaxed represent the same absolute risk as 7 unvaxed, yet there are only 3 unvaxed so you are 2.3 times as likely to get infected from fully vaxed person than unvaxed
But remember, the study reporting these Ct value changes was only looking at patients, and so will be selectively seeing unvaxed with worse outcomes than vaxed.

Also none of their analysis was demographically matched. An earlier paper by the same group was demographically matched and that found Ct changes that were half what they found without demographic controls.
So *if* the Ct changes were only half as much when one controlled for demographics then we might see:
(1*1+1*0.90+8*0.77+3*0.28+1*0.25) = 9.15
In that scenario the 14 fully vaxed are 3 times as likely to infect you as the 3 unvaxed. That was just considering one potential bias 😬
(1*1+1*0.90+8*0.77+3*0.28+1*0.25) = 9.15
In that scenario the 14 fully vaxed are 3 times as likely to infect you as the 3 unvaxed. That was just considering one potential bias 😬
Note: The OWID graphs do not clarify whether their fully vaccinated total is just "had 2nd dose" or "7 days after having 2nd dose" I have erred on the side of caution and assumed it's just "had" 2nd does, if it's 7 days then the % in 60+ increases from 50% to 56%


That represents an additional increase in risk from the fully vaxed group as there would then be 9 in the 60-120 days cohort. If you want to go crazy, consider also how many of the unvax are recovered (who have at least a 5-13x fold lower risk of getting infected than fully vax)
Our official stats are likely to under-estimate the recovered as, for example, we threw 40k potential positives off the queue for testing in April 2020. Also if this is to be believed we have 114k active cases with a 14 day recovery that's 8.2k positives per day yet we see 1.5k


So let's assume the 1.5k positives is accurate, that means there are 21k active cases right now and thus 355k recovered out of 4.9 million or 7%
Unknowns:
* how many got the vax after anyway
* how many got the vax before
* how many were positive but never got a test
Unknowns:
* how many got the vax after anyway
* how many got the vax before
* how many were positive but never got a test
If none of the recovered got the vax then that means of the 13.5% unvaxed, half of them would be no risk.
If all of the recovered got the vax then we'd need to see what impact recovered status has depending on recovered pre or post vax... so loads more questions about recovered
If all of the recovered got the vax then we'd need to see what impact recovered status has depending on recovered pre or post vax... so loads more questions about recovered
• • •
Missing some Tweet in this thread? You can try to
force a refresh


