There are two problems with ROC curves
❌ They don't work for imbalanced datasets
❌ They don't work for object detection problems
So what do we do to evaluate our machine learning models properly in these cases?
We use a Precision-Recall curve.
Another one of my threads 👇
❌ They don't work for imbalanced datasets
❌ They don't work for object detection problems
So what do we do to evaluate our machine learning models properly in these cases?
We use a Precision-Recall curve.
Another one of my threads 👇
Last week I wrote another detailed thread on ROC curves. I recommend that you read it first if you don't know what they are.
Then go on 👇
https://twitter.com/haltakov/status/1438206936680386560
Then go on 👇
❌ Problem 1 - Imbalanced Data
ROC curves measure the True Positive Rate (also known as Accuracy). So, if you have an imbalanced dataset, the ROC curve will not tell you if your classifier completely ignores the underrepresented class.
More details:
👇
ROC curves measure the True Positive Rate (also known as Accuracy). So, if you have an imbalanced dataset, the ROC curve will not tell you if your classifier completely ignores the underrepresented class.
More details:
https://twitter.com/haltakov/status/1435296511772999684
👇
❌ Problem 2 - Object Detection Problems
ROC curves measure the False Positive Rate (FPR) according to the following formula.
In object detection problems the True Negatives don't make sense. There are so many possibilities to detect the background class.
Let's dive deeper 👇
ROC curves measure the False Positive Rate (FPR) according to the following formula.
In object detection problems the True Negatives don't make sense. There are so many possibilities to detect the background class.
Let's dive deeper 👇

I'll use my favorite example again - traffic lights detection (for a self-driving car 🧠🚗).
We want to detect the presence and location (using a bounding box) of traffic lights in images. This is a typical Object Detection problem - an important class of CV problems.
👇
We want to detect the presence and location (using a bounding box) of traffic lights in images. This is a typical Object Detection problem - an important class of CV problems.
👇

The typical way to solve this is to design a neural network that will check many locations in the image and classify them as being a traffic light or not (background).
For more details, check out this thread:
Now on the actual problem 👇
For more details, check out this thread:
https://twitter.com/haltakov/status/1364348171128832001
Now on the actual problem 👇
There is no (practical) way to define True Negatives
These would be all locations in the image that don't contain a traffic light and where our model correctly predicted no traffic lights as well.
Imagine now going through all possible bounding box sizes for every pixel...
👇
These would be all locations in the image that don't contain a traffic light and where our model correctly predicted no traffic lights as well.
Imagine now going through all possible bounding box sizes for every pixel...
👇
Common evaluation metrics for this are Precision and Recall.
▪️ Precision - the percentage of traffic lights the model detected that are indeed real traffic lights
▪️ Recall - the percentage of real traffic lights that the model detected
Confusing? Let's see some examples 👇
▪️ Precision - the percentage of traffic lights the model detected that are indeed real traffic lights
▪️ Recall - the percentage of real traffic lights that the model detected
Confusing? Let's see some examples 👇

High Precision, Low Recall
In this example, the Precision is 100% (all detected lights are correct), but the Recall is only 50% (2 out of 4 lights missed).
👇
In this example, the Precision is 100% (all detected lights are correct), but the Recall is only 50% (2 out of 4 lights missed).
👇

Low Precision, High Recall
In this example, the Precision is 67% (4 out of 6 detected lights are correct), while the Recall is 100% (all 4 real lights are detected).
👇
In this example, the Precision is 67% (4 out of 6 detected lights are correct), while the Recall is 100% (all 4 real lights are detected).
👇

Precision and Recall give us a way to measure both types of errors (FPs and FNs), without requiring us to count TNs.
By the way, that's why they work better for imbalanced data! Object Detection is imbalanced - there is much more background than objects.
Now the curve 👇
By the way, that's why they work better for imbalanced data! Object Detection is imbalanced - there is much more background than objects.
Now the curve 👇
For every candidate the network classifies, it gives us the probability of it being a traffic light. We need to choose a threshold on the probability to consider it a detected light.
It could be 50% if we don't want to miss many lights or 99% if we want to be really sure.
👇
It could be 50% if we don't want to miss many lights or 99% if we want to be really sure.
👇
For every value of the threshold, we will get different Precision and Recall when evaluating our test dataset.
▪️ High thresholds - high Precision, low Recall
▪️ Low thresholds - low Precision, high Recall
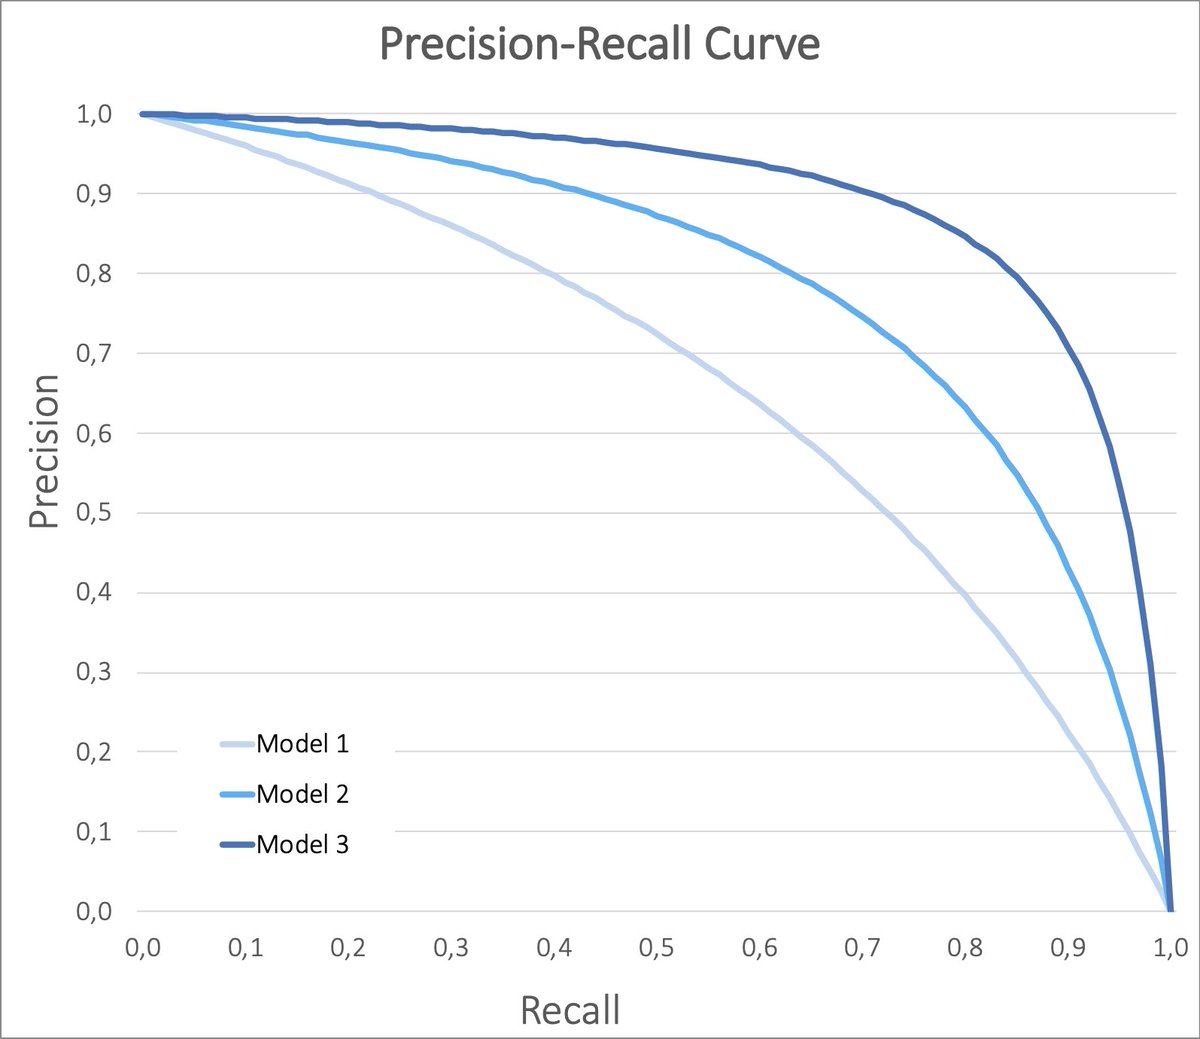
Plotting these values gives us the Precision-Recall curve.
▪️ High thresholds - high Precision, low Recall
▪️ Low thresholds - low Precision, high Recall
Plotting these values gives us the Precision-Recall curve.
The Precision-Recall Curve visualizes the trade-off between making False Positives and False Negatives.
Similar to ROC curves, we can also compare different models. If the curve of one model is closer to the upper right corner than another one, then it is a better model.
👇
Similar to ROC curves, we can also compare different models. If the curve of one model is closer to the upper right corner than another one, then it is a better model.
👇

Summary 🏁
To recap:
▪️ ROC curves don't work for imbalanced data
▪️ ROC curves don't work for object detection (can't count TNs)
▪️ Prevision-Recall curves are computed in a similar way to ROC curves
▪️ Prevision-Recall curves visualize the trade-off between FNs and FPs
To recap:
▪️ ROC curves don't work for imbalanced data
▪️ ROC curves don't work for object detection (can't count TNs)
▪️ Prevision-Recall curves are computed in a similar way to ROC curves
▪️ Prevision-Recall curves visualize the trade-off between FNs and FPs
I regularly write threads like this to help people get started with Machine Learning.
If you are interested in seeing more, follow me @haltakov.
If you are interested in seeing more, follow me @haltakov.
Yes, you are absolutely right! True Positive Rate is the Recall, not the Accuracy. Sorry for the confusion. Good catch!
https://twitter.com/zxul767/status/1440398296648863748
Oh, man 🤦♂️ This is my second typo in this thread... Thanks for correcting me. You are of course right!
https://twitter.com/JohannesTomason/status/1440747281746042886
I didn't articulate well why ROC curves are not suitable for imbalanced datasets, so here is a more detailed example:
https://twitter.com/haltakov/status/1440771087516663814
• • •
Missing some Tweet in this thread? You can try to
force a refresh