__ONS England & Wales Covid Deaths by Age as % of total Covid deaths, from Jan 2020 to 10 September 2021__

Stacked in this way, only older age groups are visible. This is because the vast majority of Covid deaths occurred in older people.
59% were aged 80+
93% were aged 60+
1/
Zooming in 10x, the chart now shows age groups which, in total, account for ~10% of all Covid deaths. (Older groups have been greyed out for clarity.)
4.3% of deaths were in people aged under 55.
1.3% were in people under 45 years old.
2/
At 100x zoom, the visible age groups, combined, make up only ~1% of total covid deaths.
0.74% of deaths were in people aged under 40.
0.19% were in people under 30 years old.
3/
Finally, 1000x zoom. The combined total of Covid deaths in the youngest age groups accounts for less than 1 in 1000 of total deaths.
0.087% of deaths were in people aged under 25.
0.014% were in people under 15 years old.
4/
Data source:
Deaths registered weekly in England and Wales, provisional: 10 September 2021 \ Weekly provisional figures on death occurrence where coronavirus (COVID-19) was mentioned on the death certificate in England and Wales.
5/

• • •

Missing some Tweet in this thread? You can try to force a refresh
 

Keep Current with Ruminator Dan (Telegram: RuminatorDan)

Ruminator Dan (Telegram: RuminatorDan) Profile picture

Stay in touch and get notified when new unrolls are available from this author!

Read all threads

This Thread may be Removed Anytime!

PDF

Twitter may remove this content at anytime! Save it as PDF for later use!

Try unrolling a thread yourself!

how to unroll video
  1. Follow @ThreadReaderApp to mention us!

  2. From a Twitter thread mention us with a keyword "unroll"
@threadreaderapp unroll

Practice here first or read more on our help page!

More from @RuminatorDan

13 Sep
Israel Minister of Health explains to Minister of the Interior that the green pass in some places is required only so as to put pressure on the unvaccinated to get vaccinated.
(clip: Israel Channel 12)
English translation in thread below.
1/
Translation:
HER: I suspect that for outdoor restaurants you can remove the green pass.
HIM: I'll tell you, in swimming pools and also restaurants. Epidemiologically it's correct.
HER: Correct.
2/
HIM: The issue is - and I'm telling it to you - our problem is people who don't get vaccinated. We need a bit so that they...
HER: To put pressure on them.
HIM: Otherwise... We won't get out of this.
3/
Read 4 tweets
11 Sep
Whilst it might not suit the narrative and seems to have annoyed people, @Peston is correct in his observation. The data to which be is referring suggest very poor effectiveness against infection.
This is far from the first such evidence (e.g. Israel).
1/
Mr Peston can hardly be accused of having been critical of the narrative thus far, which surely means that the fact that he is questioning the data now is worth listening to.
2/
Poor protection against infection invalidates any logical reason for vaccinating children, for passports, for the health apartheid being shamefully stoked by many leaders, and more.
(Not that there aren't also other equally valid reasons why all those things are very wrong.)
3/
Read 4 tweets
10 Sep
Dictatorship... Democracy...
What's all the fuss about? They both start with a D so surely that makes them nearly the same thing?

Covid and Climate start with the same letter and they're the same thing too. Image
On the democracy vs dictatorship matter...
Read 4 tweets
5 Sep
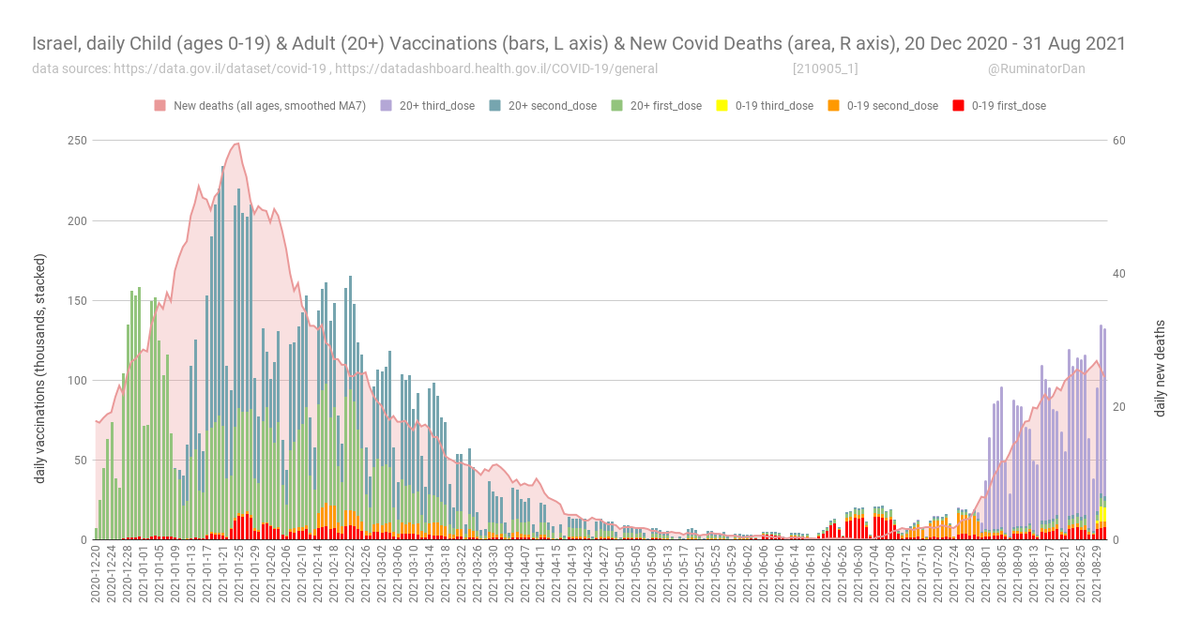
__Israel, daily Child (ages 0-19) & Adult (ages 20+) Vaccinations & 1) New Cases, 2) Hospitalisations, 3) Deaths__

1) Israel, daily Child (ages 0-19) & Adult (ages 20+) Vaccinations & New Covid Cases (all ages),
20 Dec 2020 - 31 Aug 2021
1/
2) Israel, daily Child (ages 0-19) & Adult (ages 20+) Vaccinations & Covid Hospitalisations (all ages),
20 Dec 2020 - 31 Aug 2021
2/
3) Israel, daily Child (ages 0-19) & Adult (ages 20+) Vaccinations & New Covid Deaths (all ages),
20 Dec 2020 - 31 Aug 2021
3/
Read 4 tweets
10 Aug
COVID DEATHS BY AGE, ENGLAND,
w/e 8 Mar 2020 - 1 Aug 2021

The risk of death with/of Covid varies enormously with age. England data show this clearly.
1/ ImageImage
The difference is so great that one cannot usefully plot all ages together (without resorting to log or other methods). At this scale, only the top (oldest) few age bands are clearly visible. The younger ages are also shown - but they are too small to see.
2/ Image
Here we zoom in 10 x on the vertical (y) axis. The older groups, now off the top of the chart, have been faded for clarity. The age bands shown, 0-64, together account for ~11% of total deaths in the period. That is to say, 89% of deaths occurred in people of aged 65 & older.
3/ Image
Read 8 tweets
9 Aug
COVID HOSPITALISATIONS IN THE YOUING
Repeated claims recently suggest more young people are becoming hospitalised with Covid than was the case in Jan 2021. However England's empirical data show otherwise: new hospitalisations in the young reached similar levels in July & Jan.
1/
The BBC, for example, reported recently that, in England, “levels of young adults being admitted to hospital was four times higher than the peak last winter.”
Without additional explanation, this is likely to be misinterpreted by many people.
bbc.co.uk/news/health-58…
2/
ONS Covid Insights, 6 Aug '21, shows charts of new hospital admissions by age, pointing out that "Hospital admission rates in those aged under 25 years were at similar level to rates during the peak in January 2021".
ons.gov.uk/peoplepopulati…
3/
Read 8 tweets

Did Thread Reader help you today?

Support us! We are indie developers!


This site is made by just two indie developers on a laptop doing marketing, support and development! Read more about the story.

Become a Premium Member ($3/month or $30/year) and get exclusive features!

Become Premium

Too expensive? Make a small donation by buying us coffee ($5) or help with server cost ($10)

Donate via Paypal Become our Patreon

Thank you for your support!

Follow Us on Twitter!

:(