
A few people have asked me what I think is going to happen next, so with the combination of a small model update and a bit of intuition and logic, here goes. TL;DR: I’m reasonably optimistic about the next 2-3 months, but a bit more worried about the early part of 2022. 1/n
It is clear that England has moved out of the pure epidemic phase, and into a transition that is neither wholly epidemic, nor full endemicity. The dynamics are becoming more endemic-ish (to borrow @ewanbirney’s phrase in his excellent thread) 2/n
https://twitter.com/ewanbirney/status/1442138664180539396?s=20
…but that doesn’t mean we’ve entered (or are near) a long-term equilibrium – for one thing, we still have a lot of people who’ve never caught covid, and we’re only just completing the vaccine rollout. And there’s a lot we don’t know yet (e.g. on waning rates & boosters). 3/n
So if I haven’t joined @andrew_lilico in declaring the epidemic "over", it's not so much because we disagree majorly on what’s happening, but because I worry that language will be misinterpreted and lead people to think that covid has gone away and won’t impact on our lives. 4/n
Sadly, I don’t think that’s true. But it is true that we’re in a better place than we were this time last year, with high vaccine take-up, life nearly back to normal, hospital admissions declining, and the potential for NHS-overwhelming waves much smaller than it was. 5/n
Of course, we’ve seen cases grow over the last couple of weeks, led by the 10-14s, where rates are currently very high. And there are some signs of a “swimming pool effect” (© @BristOliver) with cases now leaking into their parents’ generation. 6/n
https://twitter.com/JamesWard73/status/1442268238168080396?s=20
But my sense, confirmed by the model, is that this “schools wave” will burn out fairly quickly. I wouldn’t have chosen this route to adding immunity in younger teens, with vaccines coming along just too late, but it’s unlikely to cause massive waves of hospital admissions. 7/n
I’m also optimistic that the return of students to universities won’t have a big impact. Their vax rates and prior-infection rates are high, and they’re more isolated from older generations than schoolkids. So we might see outbreaks, but I doubt it will go much further. 8/n
So I’d expect hospital admissions to be mostly in decline in October. It’s harder to predict what happens after that, as we need to consider the effects of waning immunity, seasonality and changes to behaviour– as well as booster vaccinations. For that, we need the model. 9/n
I haven’t done a complete model re-fit, but I have updated the model from its last outing (below) with the latest case/admissions data, and a revised vaccination schedule including boosters for JCVI groups 1-9, and single doses for 12-15 year olds. 10/n
https://twitter.com/JamesWard73/status/1436043734181896202?s=20
I’ve also tweaked my assumptions on immunity waning to match my sense of the latest data (although this is still not settled yet). My central assumption on waning of VE vs. infection is now 5% per month, down from 7% in the previous model iteration. 11/n
With those assumptions, I get the following outputs for hospital admissions in England over the next few months. As before I’ll advise you not to take the figures and dates too literally, this is more about predicting broad “shapes” than specific numbers. 12/n 
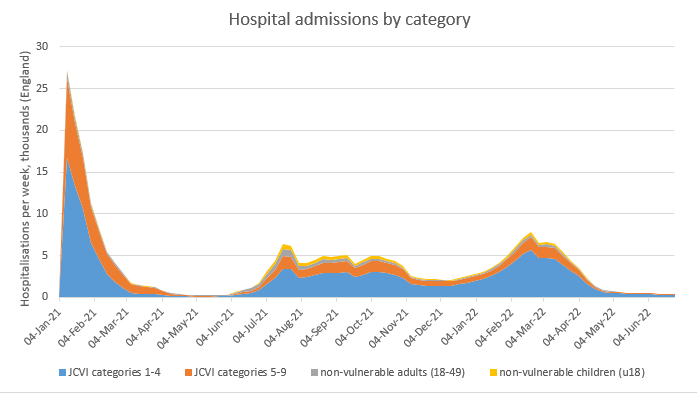
You can see here the predicted decline in October, and something of a lull during November/December before a resurgence in early 2022. Note this is driven by the combination of waning immunity and seasonality – behaviour is assumed to remain at its current adjusted levels. 13/n
By the standards of 2020 and 2021, the admissions in that early-2022 peak are not immense – around 1000 per day at peak – but if added to a difficult flu season and the existing stress on the NHS, this could still be a very challenging experience for our doctors and nurses. 14/n
And I want to emphasise: there’s a lot of uncertainty still in those projections – that peak could be significantly higher, or lower. Taking the good news first, if boosted immunity wanes much more slowly (as @andrew_croxford assures me that it will!), the peak is lower: 15/n

And we could achieve a similar effect if we chose to continue the booster programme into the non-vulnerable 18-50s, delivering these on the same 2nd dose + 6 month schedule, extending into March 2022. (once again I am skipping over the ethical pros and cons of doing this). 16/n

But on the opposite side, if a fall in cases this autumn were to lead to our behaviour reverting gradually to its pre-pandemic norm over Nov/Dec/Jan, we could see a much stronger resurgence in the early part of 2022. I don’t think this is likely, but I can’t rule it out. 17/n

And if I’ve got my tweak to the waning assumptions wrong, and my earlier estimates of 7% per month waning of VE vs. infection were closer to the mark, then we could see a higher plateau of admissions in late 2021, and a bigger peak in early 2022. 18/n

So while we may be out of the pure epidemic phase, and the risks of catastrophe are massively reduced (barring a new worse-than-Delta variant), we could still see waves of cases/admissions that will feel quite epidemic-y (to coin another phrase) to those on the front line. 19/n
What does this all mean for policy? Well, in the short term, I think not much. We should continue to follow the track of living life in our (slightly adjusted) new-normal world, while keeping a close eye on how the covid stats evolve in the coming weeks and months. 20/n
There’s still a small risk we get a big peak – most likely in Q1 2022 – that would have us reaching for the govt’s “Plan B” of mild restrictions. But my best bet is that won’t be necessary, and while covid isn’t going away, we will be heading to full endemicity during 2022. 21/n
Predicting the dynamics of that longer-term state is a whole new ballgame, and depends on some variables we have little data on (eg. not just waning and boosters, but the severity level of multiple re-infection cycles). So I won’t attempt to do that– at least, not yet. /end
• • •
Missing some Tweet in this thread? You can try to
force a refresh


