We so don't follow science

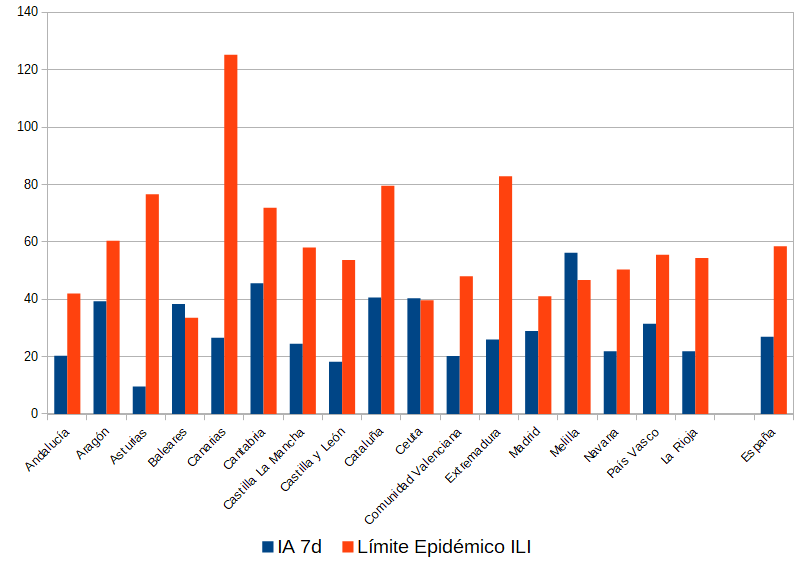
Spain's 7 days Infection Rate IR is 27 as today
NewNormal limit is <10

That arbitrary limit has NEVER BEEN EXPLAINED, it was just IMPOSED

Scientifical epidemic limit we used every year was 58.52
SIX TIMES HIGHER

For science we're in Basal Phase
Our official scientific method offered detailed yearly limits for every region (in red in previous graph) coming from historical epidemia data, including hosp pressure.

Covid Szienze imposes one round number for all.

Check thread for more info on model
Checking every region IR as a % of epidemic limit, we found the country (except one from and 2 autonomous cities, see next tweet) is clearly deep into the green NON EPIDEMIC ZONE
National average as low as ~40%

Only this mad year we would call this epidemic.

Not to say PANDEMIC
Baleares region high number is easily explainable if you check per capita test raised.

It goes x2.5 over national average.

MASS testing pressure, again, creating misleading exaggerated numbers.

No epidemic there, either.
Ceuta&Melilla are isolated cities in North Africa, and their numbers have being weird all thru crisis, due to special political&geographic characteristics.
Even though, they're so small and isolated that their implication in sittings epidemic is negligible.
For those noticing Galicia and Media absence, is because they didn't join the national system yet, a usual regional politics issue, and we've no ILI Epidemic limit for them.

They have IR of 10&33, way lower than both national average and lowest region limits.

No PANDEMIC there
We've to follow TRUE science, good old science we ALREADY were using to monitor ILI, which includes CORONAVIRUS

We've to stop this madness, only useful for maintaining fear, along with control and restrictions

Because, we're so damn NOT following science

Just Covid Szienze

• • •

Missing some Tweet in this thread? You can try to force a refresh
 

Keep Current with plaforscience

plaforscience Profile picture

Stay in touch and get notified when new unrolls are available from this author!

Read all threads

This Thread may be Removed Anytime!

PDF

Twitter may remove this content at anytime! Save it as PDF for later use!

Try unrolling a thread yourself!

how to unroll video
  1. Follow @ThreadReaderApp to mention us!

  2. From a Twitter thread mention us with a keyword "unroll"
@threadreaderapp unroll

Practice here first or read more on our help page!

More from @plaforscience

29 Sep
La IA a 7 días es de 27
El límite de NNormalidad es 10

De dónde sale ese límite de 10?! Nadie lo sabe, NUNCA se ha explicado

Ignora el límite científico que YA TENÍAMOS para considerar epidemia

Para España no llegaríamos ni a la MITAD de su valor, 58,52

NO HAY EPIDEMIA
El científico método serio, hilo, ofrecía cifras separadas por comunidad, basadas en series históricas que producían límites variables cada año

La arbitrariedad Covid impone un nunca explicado número redondo igual para todos: la ciencia SABE que no lo son
Si colocamos la IA de hoy como porcentaje del límite científico para epidemia vemos que todas las Comunidades están MUY claramente en la zona VERDE, con la media nacional apenas por encima del 40%

Ningún año, usando la ciencia, hubiéramos llamado a esto epidemia.
Este, PANDEMIA.
Read 7 tweets
28 Sep
There was lots of hints on very high minimum mandatory test numbers, and math evidence that we were unexplainably performing mainly random tests

Now we've confirmation that it depends on WHO, and the, wicked as usual, criteria

WHO leaders told it here:

who.int/docs/default-s…
We've discovered it by chance, at @OurWorldInData , and shockingly we first notice that test policy is determined by a weird, illogical, approach to positivity.

You have to have LOW positivity, or you're not testing enough, let's analyse this tool crooked implications.
They demand a positivity under ~9%, completely jumping over the lesser statistical logic, and ignoring any coherence in universe studied.

The idea that you must go out, at random general population screening, to find NEGATIVE CASES to get positivity down, is simply astonishing.
Read 8 tweets
28 Sep
Ante la demostración de que la abrumadora mayoría de los test NO están relacionados con el seguimiento de la Pandemia (trazado de contactos y sintomáticos sospechosos) el trøll afirma pomposo que no se están haciendo test porque sí:

Tiene razón

Se hacen porque lo manda la OMS
Gracias a una escondida nota de la muy Covidiana @OurWorldInData hemos encontrado la 'política aconsejada, (a los efectos: la ley de Dios: lo que diga la OMS), hasta ahora opacas. Los máximos dirigentes de la OMS lo contaron en un debate en marzo.

who.int/docs/default-s…
Para mi asombro el énfasis de presión de test se basa en buscar POSITIVIDADES bajas, no como objetivo epidémico (poca transmisión) sino como un indicador de la política de test!

Lo de hacer test a un universo comparable, el criterio estadístico y la mínima lógica son ignoradas.
Read 9 tweets
28 Sep
Se han realizado 2.784.002.912 test Covid

2.555.000.000 completamente INÚTILES NEGATIVOS y redundantes

A precio de amigo (test, personal, G generales!) 50€, son ~130.000 M€ tirados si retrete

Los test no han evitado ninguna ola,
Así que piensa dónde va la tubería del retrete
Nos cuentan constantemente las cifras globales de casos, de muertes, de todo; pero la de test, nunca.
También @OurWorldInData la esconde, pero sus datos no.

Porque esta cifra por si sola expone la brutal desproporción

Imaginad lo que harían 130.000 millones € contra el hambre!
Y contra la malaria o el SIDA, en agua potable y saneamiento, en vacunaciones imprescindibles para niños, en educación, microcréditos para mujeres?

Pero elegimos tirar ese dinero por el retrete porque estábamos aterrados por La Covín

El #héroe Covid es de un egoísmo nauseabundo
Read 4 tweets
28 Sep
As 27/9 we have performed 2.784.002.912 Covid test.

~2.555.000.000 of them completely USELESS NEGATIVE and redundant.

At a CHEAP 50€ (test, personnel & general costs) that's €~130 BILLION went down the drain

As tests has avoided NO outbreak,
Ask yourself where the drain ends Image
Data from @OurWorldInData , one of the most Covidian biased platforms

Curiously, among TONS of charts&data, ALWAYS accompanied with the worst scaring explain; you CAN'T find this huge, absolutely disproportioned figure

But you can calculate adding national numbers they provide Image
We constantly hear final numbers of deaths, cases, ICU, Loooong Covid, and who knows what, but global cumulative test, never
As hidden as in @OurWorldInData

Because number is SO monstrous that exposes Covid vicious disproportion at once

What could 130 BILLION do for starving?!
Read 5 tweets
27 Sep
Lack of explanation is a characteristic of bad, or fake, science.

There's no Covidian rational explanation for Spain's so-called 5th wave.
Neither for its increase, nor for its decrease.

Because it's a fake wave.

Let's check Covid Szienze's Usual Suspects:
Restrictions (from OWiD) were flat/slightly decreasing all thru 5th wave.

No easing caused increase, no tightening provoked decrease.

Now, with the lowest restriction level, soft decrease continues.

Nothing to blame here, then.
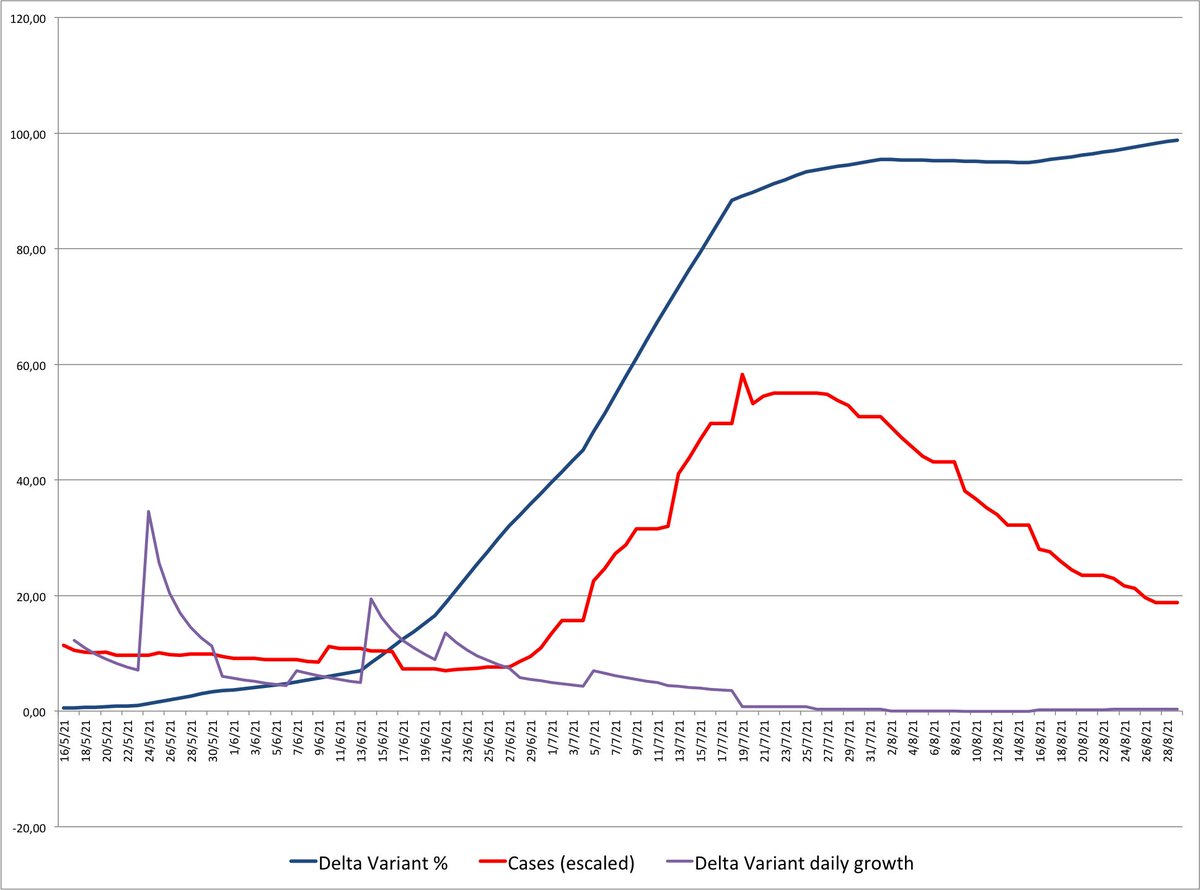
Delta Force Våriant appeared~25/5, &grew steeply from~13/6

For a full month, until~27/6, cases plateaued down nonchalant to Delta spread,including 2 weeks of STRONG increase

Suddenly,at 40% of Delta share,it explodes
But when it reaches~100% (MAX danger) cases went DOWN QUICKLY
Read 9 tweets

Did Thread Reader help you today?

Support us! We are indie developers!


This site is made by just two indie developers on a laptop doing marketing, support and development! Read more about the story.

Become a Premium Member ($3/month or $30/year) and get exclusive features!

Become Premium

Too expensive? Make a small donation by buying us coffee ($5) or help with server cost ($10)

Donate via Paypal Become our Patreon

Thank you for your support!

Follow Us on Twitter!

:(