83/
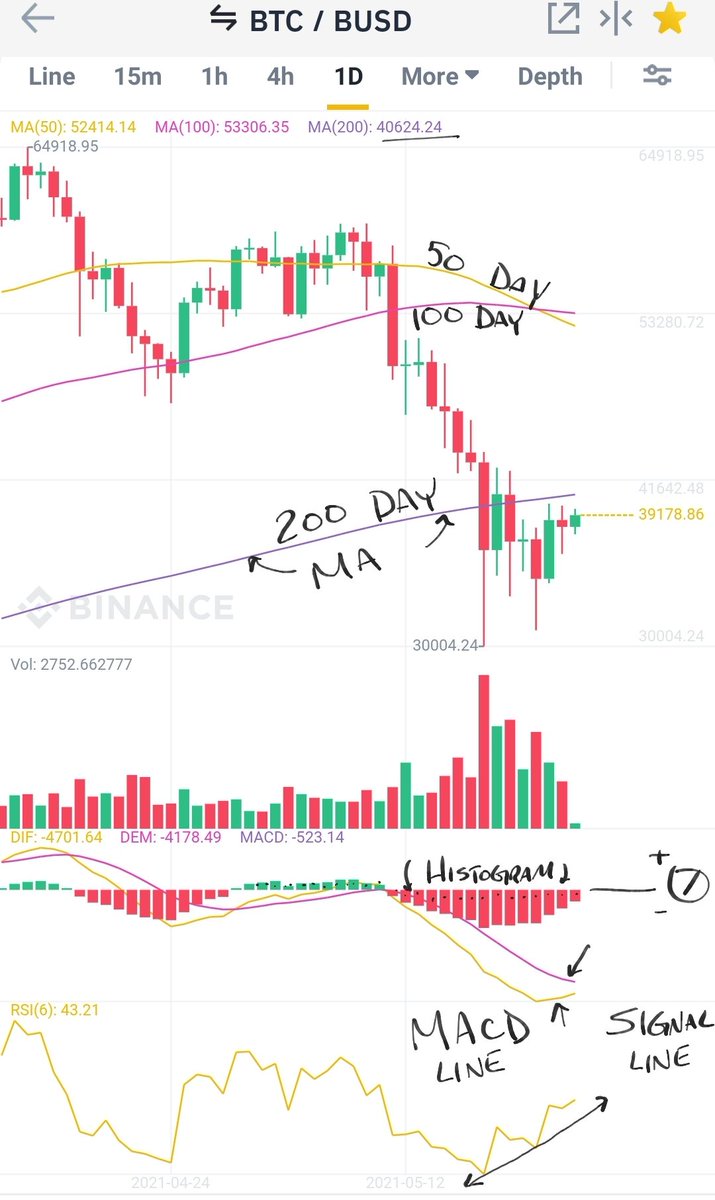
As mentioned in 81/ the trend has changed and you saw/seeing the 100 Day MA to act as Support & the 50 & 200 act as Resistance(which is the existing $41K-45K trading range)
The MACD hasn't crossed back over the 0 line to return the daily trend back to an UPtrend but it will.
As mentioned in 81/ the trend has changed and you saw/seeing the 100 Day MA to act as Support & the 50 & 200 act as Resistance(which is the existing $41K-45K trading range)
The MACD hasn't crossed back over the 0 line to return the daily trend back to an UPtrend but it will.

84/
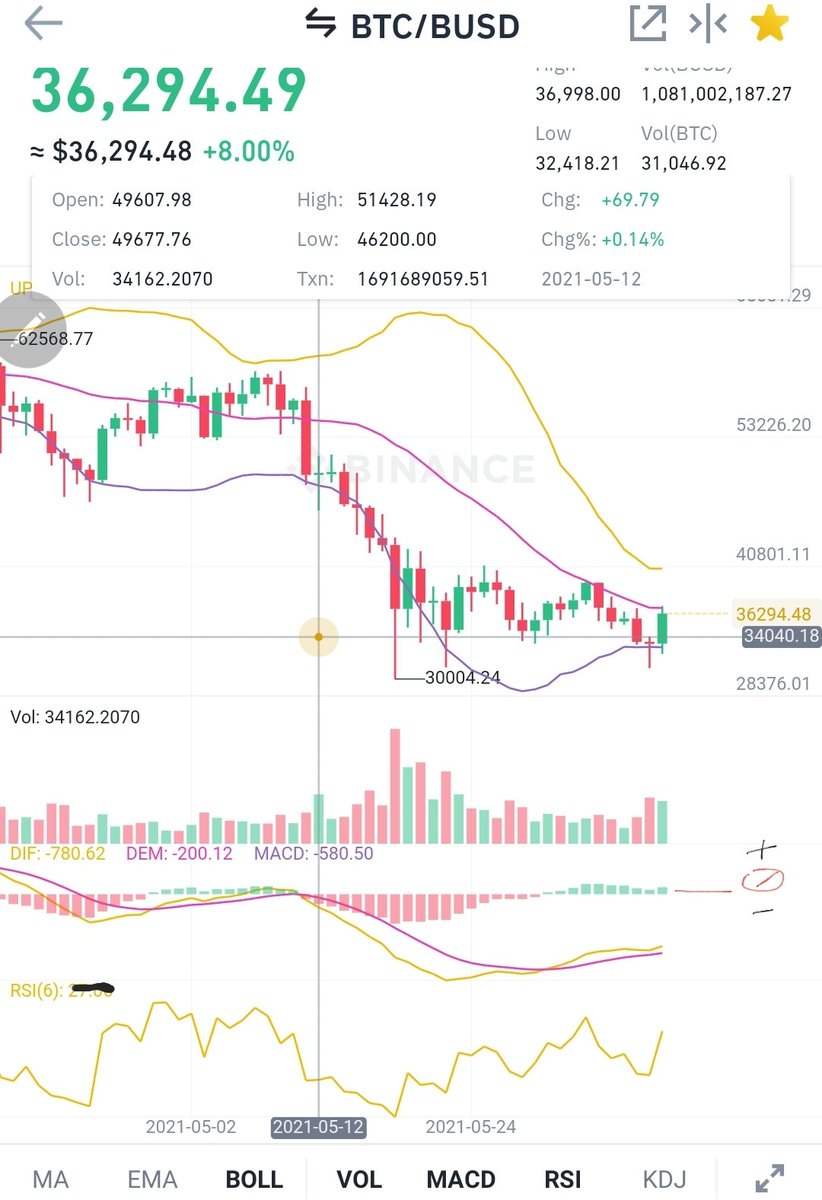
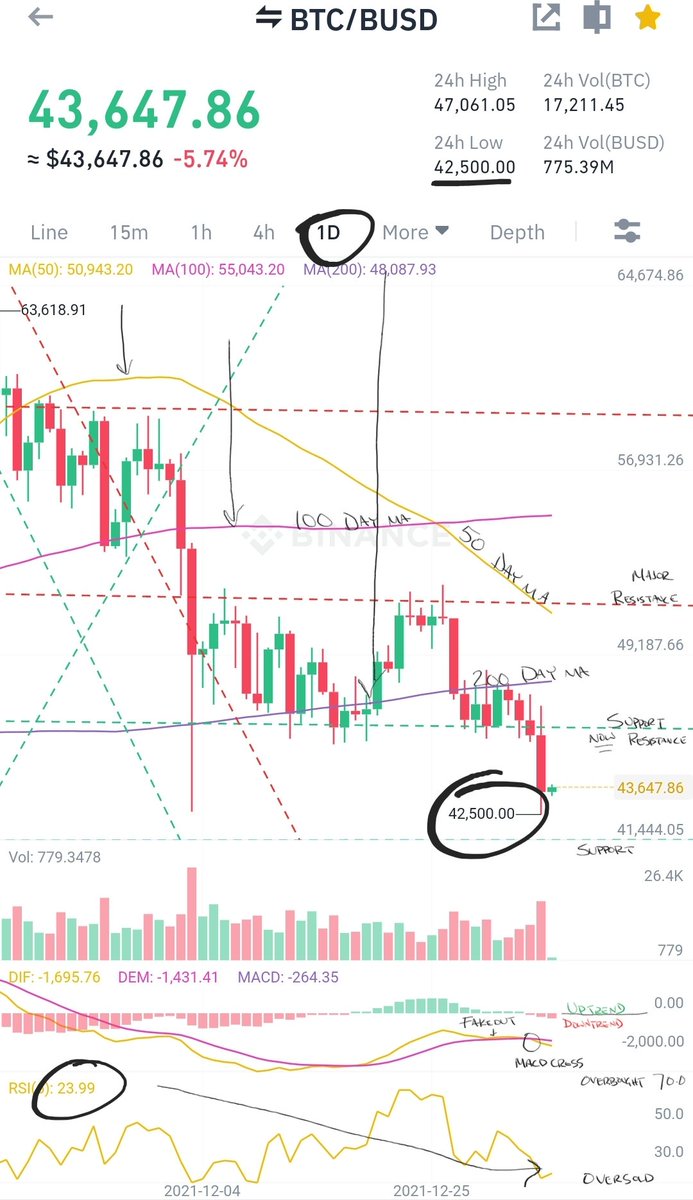
What could happen, happened as mentioned in 82/. Today you are seeing a fight between Bulls & Bears to try and turn $41K Support back into Resistance as the RSI weakens & the MACD stay under the 0 line. Today is a critical day in traders decision making. To long or to short?
What could happen, happened as mentioned in 82/. Today you are seeing a fight between Bulls & Bears to try and turn $41K Support back into Resistance as the RSI weakens & the MACD stay under the 0 line. Today is a critical day in traders decision making. To long or to short?

85/
Also as mentioned in 82/ you saw (over the past 6 days) Volume decline with only 1 spike due to investors buying the dip as #Bitcoin opened as high as $45K and dipped down to $40K.
Good news: we haven't seen a retest of $34K-$37K.
Also as mentioned in 82/ you saw (over the past 6 days) Volume decline with only 1 spike due to investors buying the dip as #Bitcoin opened as high as $45K and dipped down to $40K.
Good news: we haven't seen a retest of $34K-$37K.

86/
Now what?
There are a few scenarios.
1. As traders see the Oversold RSI rating, they will buy and increase price [the MACD lines will make their way back to the 0 line as a result]
2. An unexpected 'Death Cross' as the 50 Day MA potentially crosses the 200 Day MA again.
Now what?
There are a few scenarios.
1. As traders see the Oversold RSI rating, they will buy and increase price [the MACD lines will make their way back to the 0 line as a result]
2. An unexpected 'Death Cross' as the 50 Day MA potentially crosses the 200 Day MA again.

87/
3. A continued sideways trend between $41K-$45K Support & Resistance.
4. A retest of the $34K-$37K support range.
*Traders move the Market and it will always be hard trying to interpret what the Bulls & Bears will do next. This is why there is no such thing as a TA expert.
3. A continued sideways trend between $41K-$45K Support & Resistance.
4. A retest of the $34K-$37K support range.
*Traders move the Market and it will always be hard trying to interpret what the Bulls & Bears will do next. This is why there is no such thing as a TA expert.

88/
As mentioned in 86/ & 87/ there were a few scenarios as to what will happen next with #Bitcoin
The 1st scenario has played out. Traders saw the *Oversold RSI rating and started buying and going 'Long.' The MACD lines have made their way back to the 0 line as a result.
As mentioned in 86/ & 87/ there were a few scenarios as to what will happen next with #Bitcoin
The 1st scenario has played out. Traders saw the *Oversold RSI rating and started buying and going 'Long.' The MACD lines have made their way back to the 0 line as a result.

89/
Resistance (which is also the 50 Day MA) has become Support, again. Resistance will eventually turn into Support but Support will not always turn back into Resistance. The next Resistance, which was once Support is at the $51K range.
#Bitcoin
Resistance (which is also the 50 Day MA) has become Support, again. Resistance will eventually turn into Support but Support will not always turn back into Resistance. The next Resistance, which was once Support is at the $51K range.
#Bitcoin

90/
So now what?
•Well, scenarios 2-4 mentioned in 86/ & 87/ are not completely off the table.
•As the RSI went from Oversold to now almost Overbought in the last few days, traders are yet at another crossroad. You could actually see the RSI reach 80+ on this Bullrun.
So now what?
•Well, scenarios 2-4 mentioned in 86/ & 87/ are not completely off the table.
•As the RSI went from Oversold to now almost Overbought in the last few days, traders are yet at another crossroad. You could actually see the RSI reach 80+ on this Bullrun.
91/
•If both lines of the MACD cross over the 0 line you could see a retest of Resistance but you could also see a 'Fakeout' if both lines do not cross.
•As mentioned before the 100 Day MA will eventually cross over the 200 Day MA.
*All signals are Bullish at this moment.
•If both lines of the MACD cross over the 0 line you could see a retest of Resistance but you could also see a 'Fakeout' if both lines do not cross.
•As mentioned before the 100 Day MA will eventually cross over the 200 Day MA.
*All signals are Bullish at this moment.

92/ [Revision]
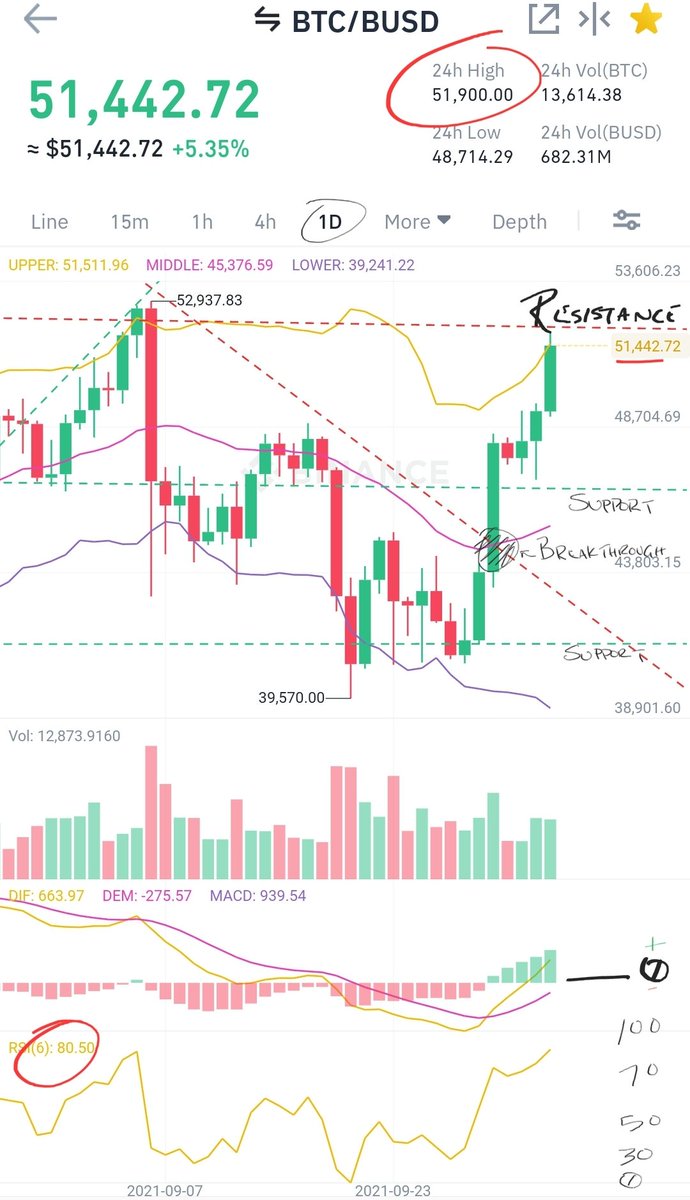
As mentioned in 90/ the RSI is now at 80 but it could go as high as 90 but never above 100. The Bulls are destroying the Bears!!
Now that we are at heavy Resistance of $52K the real fight begins. As always, to long or to short? Traders have a hard job. Lol.
As mentioned in 90/ the RSI is now at 80 but it could go as high as 90 but never above 100. The Bulls are destroying the Bears!!
Now that we are at heavy Resistance of $52K the real fight begins. As always, to long or to short? Traders have a hard job. Lol.
93/
As mentioned in 91/ you saw the MACD cross over the 0 line and you saw a retest of all Resistance levels from $52K to near the previous ATH. As mentioned, all signals were Bullish. Soon the 100 Day MA will cross over the 200 Day MA.
#Bitcoin
As mentioned in 91/ you saw the MACD cross over the 0 line and you saw a retest of all Resistance levels from $52K to near the previous ATH. As mentioned, all signals were Bullish. Soon the 100 Day MA will cross over the 200 Day MA.
#Bitcoin

94/
As mentioned in the Revision in 92/ you saw the RSI reach and surpass a 80 reading going as high as 87. Those who shorted at $52K were liquidated & those who went long were rewarded. It's always 50/50 from entry when trading futures or options. The Bulls destroyed the Bears.
As mentioned in the Revision in 92/ you saw the RSI reach and surpass a 80 reading going as high as 87. Those who shorted at $52K were liquidated & those who went long were rewarded. It's always 50/50 from entry when trading futures or options. The Bulls destroyed the Bears.

95/
Now what!?
It's never easy but you have to go with the flow of the Market.
You could see:
•A retracement to Support at $52K
•The MACD cross
•The RSI reach oversold levels as it has been overbought for many days now.
•New ATH as the overall Daily trend is UP.
*FA > TA
Now what!?
It's never easy but you have to go with the flow of the Market.
You could see:
•A retracement to Support at $52K
•The MACD cross
•The RSI reach oversold levels as it has been overbought for many days now.
•New ATH as the overall Daily trend is UP.
*FA > TA

96/
As mentioned in 93/ & earlier posts all signals were Bullish and you saw the 100 Day MA cross over the 200 Day MA. This was a very significant sentiment in TA and as you saw over the past week & a half the price climb. Traders take TA trading signals very seriously.
#Bitcoin
As mentioned in 93/ & earlier posts all signals were Bullish and you saw the 100 Day MA cross over the 200 Day MA. This was a very significant sentiment in TA and as you saw over the past week & a half the price climb. Traders take TA trading signals very seriously.
#Bitcoin

97/
As mentioned in 95/ you saw:
✅New All-Time High (ATH) as the overall trend is up. The MACD determines the trend on any timeframe. The longer the timeframe the better the signal.
✅RSI reach oversold levels going as low as 37.
✅The MACD cross.
As mentioned in 95/ you saw:
✅New All-Time High (ATH) as the overall trend is up. The MACD determines the trend on any timeframe. The longer the timeframe the better the signal.
✅RSI reach oversold levels going as low as 37.
✅The MACD cross.
98/
Also as mentioned in 95/ I stated that you could see retracements to $52K. This hasn't happened as of yet but eventually it will. Retracements are necessary to shake out weak hands and trigger stop losses & longs(Futures).
Also as mentioned in 95/ I stated that you could see retracements to $52K. This hasn't happened as of yet but eventually it will. Retracements are necessary to shake out weak hands and trigger stop losses & longs(Futures).

99/
What an interesting 3 weeks! $69K ATH
#Bitcoin reached new ATH's after another. Now what?
There are always a few scenarios: Over the next weeks:
•As mentioned in 98/ you could still see retracements to $52K
Traders move the Market and manipulation is easier with low volume.
What an interesting 3 weeks! $69K ATH
#Bitcoin reached new ATH's after another. Now what?
There are always a few scenarios: Over the next weeks:
•As mentioned in 98/ you could still see retracements to $52K
Traders move the Market and manipulation is easier with low volume.

100/
Also over the next few weeks you could see:
•$60K act as Resistance after being Support for the past 2 weeks.
•The 50 Day MA & 100 Day MA act as Support & Resistance.
•MACD 'Fakeout' cross followed by a cross below the 0 line.
•The Daily trend change.
Also over the next few weeks you could see:
•$60K act as Resistance after being Support for the past 2 weeks.
•The 50 Day MA & 100 Day MA act as Support & Resistance.
•MACD 'Fakeout' cross followed by a cross below the 0 line.
•The Daily trend change.

101/
As mentioned in 100/ you are seeing:
✅$60K act as Resistance.
✅The 50 & 100 Day MA acting as Support & Resistance.
✅MACD 'Fakeout' followed by a cross below the 0 line.
✅The Daily trend change.
#Bitcoin
As mentioned in 100/ you are seeing:
✅$60K act as Resistance.
✅The 50 & 100 Day MA acting as Support & Resistance.
✅MACD 'Fakeout' followed by a cross below the 0 line.
✅The Daily trend change.
#Bitcoin

102/
Over the next days or so the most important indicator to watch is the 100 Day MA. Expect major volatility. This is major support and the fight between the Bulls & Bears will get tougher. Expect a bounce off and a possible breakthrough. The Market Makers are smart.
Over the next days or so the most important indicator to watch is the 100 Day MA. Expect major volatility. This is major support and the fight between the Bulls & Bears will get tougher. Expect a bounce off and a possible breakthrough. The Market Makers are smart.

103/
As mentioned in 95/,98/,99/ you are seeing that $52K range breached. This is major support.
Also as mentioned in 100/ you saw over the past week a continued:
•$60K act as Resistance and the 50 Day MA & 100 Day MA act as Support & Resistance respectively.
#Bitcoin
As mentioned in 95/,98/,99/ you are seeing that $52K range breached. This is major support.
Also as mentioned in 100/ you saw over the past week a continued:
•$60K act as Resistance and the 50 Day MA & 100 Day MA act as Support & Resistance respectively.
#Bitcoin

104/
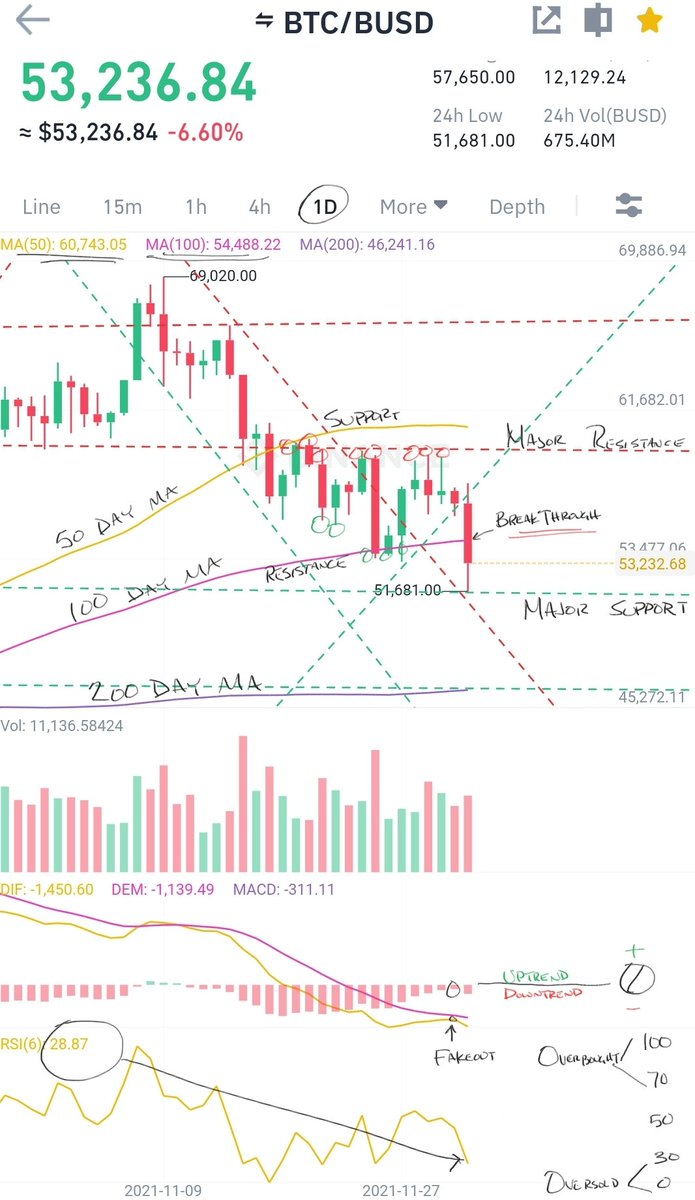
As mentioned in 102/ you saw and are seeing major volatility as the 100 Day MA is breached. The Bears are trying to turn this Support level into Resistance. Also as mentioned, you saw the price bounce off of the 100 Day MA a few times before today's breakthrough.
As mentioned in 102/ you saw and are seeing major volatility as the 100 Day MA is breached. The Bears are trying to turn this Support level into Resistance. Also as mentioned, you saw the price bounce off of the 100 Day MA a few times before today's breakthrough.
105/
Now what?
A few scenarios:
•Now that the price is in oversold territory in respects to the RSI, you could see a reversal to at least a score of 40-50's.
•You could see a retest of previous Support at the 200 Day MA if the Bulls turn the 100 Day MA back into Resistance.
Now what?
A few scenarios:
•Now that the price is in oversold territory in respects to the RSI, you could see a reversal to at least a score of 40-50's.
•You could see a retest of previous Support at the 200 Day MA if the Bulls turn the 100 Day MA back into Resistance.

106/
As mentioned in 104/ the Bears have accomplished turning the 100 Day MA Support level into Resistance. The past week or so has been very volatile due to many circumstances. One being Options contracts, the other, simply a trend change. #Bitcoin
As mentioned in 104/ the Bears have accomplished turning the 100 Day MA Support level into Resistance. The past week or so has been very volatile due to many circumstances. One being Options contracts, the other, simply a trend change. #Bitcoin

107/
As mentioned in 105/ you saw the price action reach the Oversold RSI reading on many levels before a reversal to the 40's. The Bulls couldn't reach the 50's yet but eventually they will.
Also as mentioned you saw and are seeing a retest of the 200 Day MA support.
As mentioned in 105/ you saw the price action reach the Oversold RSI reading on many levels before a reversal to the 40's. The Bulls couldn't reach the 50's yet but eventually they will.
Also as mentioned you saw and are seeing a retest of the 200 Day MA support.

108/
Now what!?
A few scenarios over the next few days to a week.
•You could see another reversal as the price action is in Oversold territory.
•You could see a retest of previous Support at $42K range as mentioned in several earlier Tweets in this thread.
Now what!?
A few scenarios over the next few days to a week.
•You could see another reversal as the price action is in Oversold territory.
•You could see a retest of previous Support at $42K range as mentioned in several earlier Tweets in this thread.

109/
•Another scenario includes a 'Death Cross' (by definition) as the 50 day MA looks to cross the 100 Day MA. If the Bulls cannot regain control this is likely to occur.
•Ultimately the MACD & Signal line will cross one another after a few 'Fakeouts' & the trend will change.
•Another scenario includes a 'Death Cross' (by definition) as the 50 day MA looks to cross the 100 Day MA. If the Bulls cannot regain control this is likely to occur.
•Ultimately the MACD & Signal line will cross one another after a few 'Fakeouts' & the trend will change.

110/
As mentioned in 108/ there were a few scenarios as to what will happen next.
✅You could see another reversal [to Overbought] as the price action is in Oversold territory.
❌You could see another retest of previous Support at $42K range. (This is still a possibility)
As mentioned in 108/ there were a few scenarios as to what will happen next.
✅You could see another reversal [to Overbought] as the price action is in Oversold territory.
❌You could see another retest of previous Support at $42K range. (This is still a possibility)

111/
In entry 109/:
✅.. a 'Death Cross' (by definition) as the 50 day Moving Average (MA) crossed the 100 Day MA.
✅MACD & Signal line crossed one another after a few 'Fakeouts.'
The daily trend will still ultimately change.
In entry 109/:
✅.. a 'Death Cross' (by definition) as the 50 day Moving Average (MA) crossed the 100 Day MA.
✅MACD & Signal line crossed one another after a few 'Fakeouts.'
The daily trend will still ultimately change.

112/
What to watch:
Continue seeing this sideways trend until there is a breakout and *close* below $45K (support) or above $52K (resistance). This sideways price action has been going on for almost a month and until there is a breakout expect price action in between the two.
What to watch:
Continue seeing this sideways trend until there is a breakout and *close* below $45K (support) or above $52K (resistance). This sideways price action has been going on for almost a month and until there is a breakout expect price action in between the two.

113/
I can only guess what the indicators will look like over the next week or so. If I had to guess you'd see a MACD 'Fakeout' followed by a trend change; but not before a retest of the 200 Day Moving Average and an Oversold reading.
Here's what it could look like:✏
I can only guess what the indicators will look like over the next week or so. If I had to guess you'd see a MACD 'Fakeout' followed by a trend change; but not before a retest of the 200 Day Moving Average and an Oversold reading.
Here's what it could look like:✏


114/
As mentioned in 110/ $42K price range was still a possibility and today the Bears managed to reach $42.5K, which is the next support range. The overall DAILY trend is still down so while we can be optimistic, we should never trade against the trend no matter the timeframe.
As mentioned in 110/ $42K price range was still a possibility and today the Bears managed to reach $42.5K, which is the next support range. The overall DAILY trend is still down so while we can be optimistic, we should never trade against the trend no matter the timeframe.

115/
As mentioned in 112/ we had things to watch for.
This is where we stand:
Since then we continued to see a sideways price action until today's Breakout below $45K. This breakout is confirmation of a new price range. Support at $45K is now looking to turn into Resistance.
As mentioned in 112/ we had things to watch for.
This is where we stand:
Since then we continued to see a sideways price action until today's Breakout below $45K. This breakout is confirmation of a new price range. Support at $45K is now looking to turn into Resistance.

116/
The drawings projection was off in 113/.. lol. However, regarding the context you did and didn't see:
✅MACD 'Fakeout.'
✅Retest of 200 Day Moving Average
✅Oversold RSI
❌No daily trend change. (yet)
#Bitcoin
The drawings projection was off in 113/.. lol. However, regarding the context you did and didn't see:
✅MACD 'Fakeout.'
✅Retest of 200 Day Moving Average
✅Oversold RSI
❌No daily trend change. (yet)
#Bitcoin

117/
Now what!?
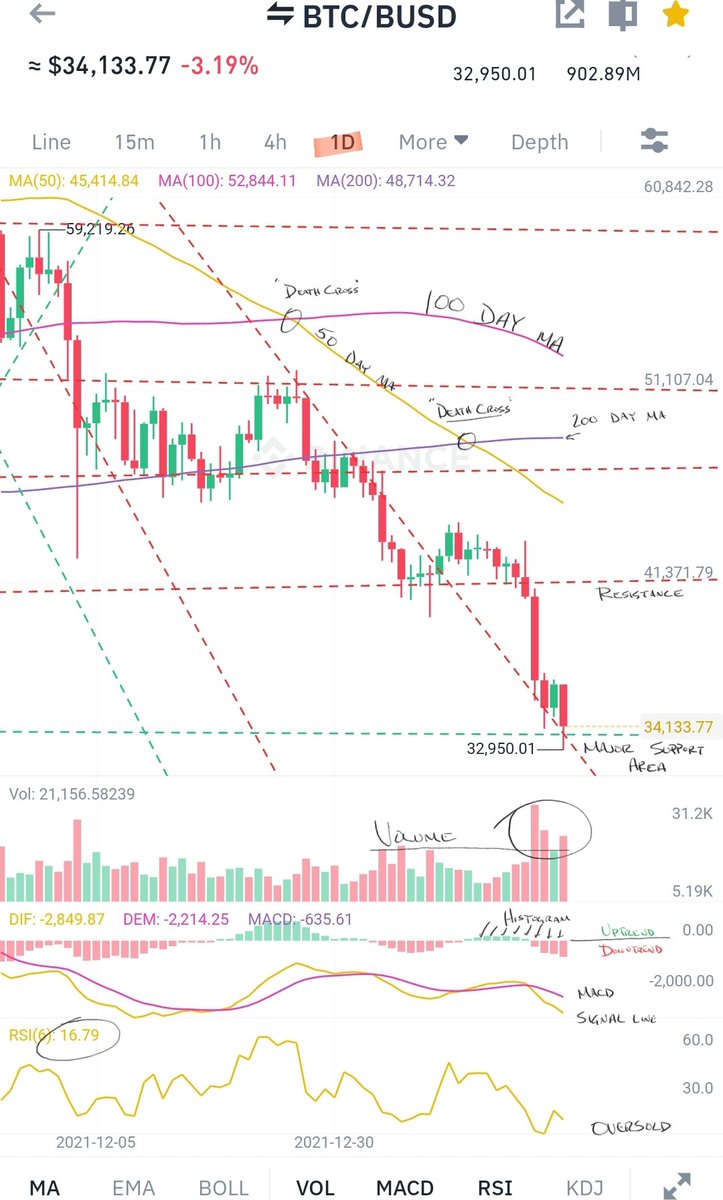
Following the Death Cross of the 50 day Moving Average (MA) crossing the 100 day MA, you could see another Death Cross (by definition), as the 50 day MA looks to cross the 200 day MA. This could suppress prices even more as trader's sentiment will change.
Now what!?
Following the Death Cross of the 50 day Moving Average (MA) crossing the 100 day MA, you could see another Death Cross (by definition), as the 50 day MA looks to cross the 200 day MA. This could suppress prices even more as trader's sentiment will change.
118/
Now what pt.2
As the price of #Bitcoin dips into Oversold RSI rating, you will likely see a spike (reversal) to near Overbought ratings.
You could also see yet another sideways price action over the next week or so in between $42K & $45K before yet another breakout.
Now what pt.2
As the price of #Bitcoin dips into Oversold RSI rating, you will likely see a spike (reversal) to near Overbought ratings.
You could also see yet another sideways price action over the next week or so in between $42K & $45K before yet another breakout.

119/
Quick update:
As mentioned in 117/ we saw yet another 'Death Cross' with the 50 day MA crossing the 200 day MA. Prices dipped as low as $39K in anticipation. Trader's sentiment is still 50/50. This is exactly what the Market Makers need to move prices to the next level.
Quick update:
As mentioned in 117/ we saw yet another 'Death Cross' with the 50 day MA crossing the 200 day MA. Prices dipped as low as $39K in anticipation. Trader's sentiment is still 50/50. This is exactly what the Market Makers need to move prices to the next level.

120/
As mentioned in 118/ you saw the RSI reach oversold rating going as low as 15.45 before reversing to *near overbought* of 52.53.
•0-30 = oversold
•70-100 = overbought
Also as mentioned you are seeing price trade in between $42K & $45K.
#Bitcoin
As mentioned in 118/ you saw the RSI reach oversold rating going as low as 15.45 before reversing to *near overbought* of 52.53.
•0-30 = oversold
•70-100 = overbought
Also as mentioned you are seeing price trade in between $42K & $45K.
#Bitcoin

121/
Now what ext.:
Continue to see what is mentioned in 118 & 120 which is the sideways price action. There will soon be a breakout as the Market Makers will have to move forward.
Also the daily trend is still down so don't be surprised to see another dip before the reversal.
Now what ext.:
Continue to see what is mentioned in 118 & 120 which is the sideways price action. There will soon be a breakout as the Market Makers will have to move forward.
Also the daily trend is still down so don't be surprised to see another dip before the reversal.

122/
Post 'Death Cross' you are seeing the actual effects of it, which simply means that average price per #Bitcoin is changing. Market Markers were successful in the 50/50 sentiment as some called $38K bottom, others a reversal. Next levels were reached as mentioned in 119/.
Post 'Death Cross' you are seeing the actual effects of it, which simply means that average price per #Bitcoin is changing. Market Markers were successful in the 50/50 sentiment as some called $38K bottom, others a reversal. Next levels were reached as mentioned in 119/.
123/
As mentioned in 121/ you continued to see a sideways price action between for 3 days before the 'breakout.' The Market Makers had to move forward with price action. No surprises there.
Also as mentioned in 121/ you saw a dip in price from $42K to $33K as the trend is down.
As mentioned in 121/ you continued to see a sideways price action between for 3 days before the 'breakout.' The Market Makers had to move forward with price action. No surprises there.
Also as mentioned in 121/ you saw a dip in price from $42K to $33K as the trend is down.

124/
Now what!?
Look forward to seeing a fight between the Bulls & Bears at $33K as this support level started as resistance back in January 2021. Within a month $33K turned into major support.
If the Bears win expect a retest of support at $28K. If the Bulls win, back to $42K.
Now what!?
Look forward to seeing a fight between the Bulls & Bears at $33K as this support level started as resistance back in January 2021. Within a month $33K turned into major support.
If the Bears win expect a retest of support at $28K. If the Bulls win, back to $42K.

125/
The Market Makers have one more trick up their sleeves. The Moving Averages (MA) have changed so much that it now appears that the 100 day MA is set to cross the 200 day MA for yet another Death Cross. With this, traders will be confused; to long or to short?? 🤔
The Market Makers have one more trick up their sleeves. The Moving Averages (MA) have changed so much that it now appears that the 100 day MA is set to cross the 200 day MA for yet another Death Cross. With this, traders will be confused; to long or to short?? 🤔

126/
As mentioned in 124/ you saw a fight at major support @ $33K. The Bulls put up a strong fight making higher lows following the days after Bears breached this major support range. Bulls reclaimed victory at $42K and now the same ol question remains; to long or to short? #BTC
As mentioned in 124/ you saw a fight at major support @ $33K. The Bulls put up a strong fight making higher lows following the days after Bears breached this major support range. Bulls reclaimed victory at $42K and now the same ol question remains; to long or to short? #BTC

127/
As mentioned in 125/ another Death Cross (by definition) is soon to happen as the Market Makers are trying to confuse traders. There will always be 'Fakeouts' so always be on the look out for them. Don't let price discovery confuse you; never trade against the trend.
As mentioned in 125/ another Death Cross (by definition) is soon to happen as the Market Makers are trying to confuse traders. There will always be 'Fakeouts' so always be on the look out for them. Don't let price discovery confuse you; never trade against the trend.

128/
Over the past 48 hours there has been indecisiveness within the Market. When prices are stagnant you start seeing Doji's, it's time to pay close attention.
Things to watch:
•RSI is Overbought
•The MACD/Signal Line still below the 0 line; but looks to cross over soon.
Over the past 48 hours there has been indecisiveness within the Market. When prices are stagnant you start seeing Doji's, it's time to pay close attention.
Things to watch:
•RSI is Overbought
•The MACD/Signal Line still below the 0 line; but looks to cross over soon.

129/
Things to watch cont.
•The Histogram bars
•The 100 day Moving Average (MA) & the 200 day MA.
•Current Trend lines
•$42K act as resistance before turning back into support.
•Retracements from overbought to near oversold.
Things to watch cont.
•The Histogram bars
•The 100 day Moving Average (MA) & the 200 day MA.
•Current Trend lines
•$42K act as resistance before turning back into support.
•Retracements from overbought to near oversold.

130/
As mentioned in 126/ the Bulls declared victory as they turned resistance of $42K back into support. Those who went long were profitable while those who shorted got liquidated. Once again, the same ol question remains; to long or to short at $42K? 🐂 or 🐻? #Bitcoin
As mentioned in 126/ the Bulls declared victory as they turned resistance of $42K back into support. Those who went long were profitable while those who shorted got liquidated. Once again, the same ol question remains; to long or to short at $42K? 🐂 or 🐻? #Bitcoin

131/
As mentioned in 127/ you saw another Death Cross (by definition) as the 100 Day Moving Average (MA) crossed below the 200 day MA. Unsurprisingly the price spiked before the cross and it's effects. Again, as mentioned over and over, be on the lookout for 'Fakeouts.'
As mentioned in 127/ you saw another Death Cross (by definition) as the 100 Day Moving Average (MA) crossed below the 200 day MA. Unsurprisingly the price spiked before the cross and it's effects. Again, as mentioned over and over, be on the lookout for 'Fakeouts.'

132/
As mentioned in 128/ you saw Doji's, which represents indecisiveness between Bulls & Bears. While the Bulls won the Doji war, reaching $45K, they are now back in the same situation just over a week later. The last few days have been nothing but Doji's. Who will win?
As mentioned in 128/ you saw Doji's, which represents indecisiveness between Bulls & Bears. While the Bulls won the Doji war, reaching $45K, they are now back in the same situation just over a week later. The last few days have been nothing but Doji's. Who will win?

133/
In 128/ & 129/ there were things to watch:
•The RSI was overbought at 73 but Bulls were able to reach 82 before running out of steam.
•The MACD/SL has crossed the 0 line as expected. The daily trend has technically changed.
•$42K is a major area of support & resistance.
In 128/ & 129/ there were things to watch:
•The RSI was overbought at 73 but Bulls were able to reach 82 before running out of steam.
•The MACD/SL has crossed the 0 line as expected. The daily trend has technically changed.
•$42K is a major area of support & resistance.

134/
Now what?
•Expect a Breakout over the next 24-48 hours after the current sideways price action.
•Expect several 'Fakeouts' as the MACD & Signal line are both above the 0 line (for now) which will confuse traders. Traders sentiment should be 50/50 at this moment. #Bitcoin
Now what?
•Expect a Breakout over the next 24-48 hours after the current sideways price action.
•Expect several 'Fakeouts' as the MACD & Signal line are both above the 0 line (for now) which will confuse traders. Traders sentiment should be 50/50 at this moment. #Bitcoin

135/
Now what? pt.2
•You could see the MACD & Signal line cross back over the 0 line back into downtrend territory. The Market Makers will always try to take advantage of traders.
•If major support at $42K holds then expect a retest of the next resistance level of $45K.
Now what? pt.2
•You could see the MACD & Signal line cross back over the 0 line back into downtrend territory. The Market Makers will always try to take advantage of traders.
•If major support at $42K holds then expect a retest of the next resistance level of $45K.

136/
Over the last week it has been a few breakouts, a few fakeouts, major support turned back into resistance, as well as more indecisiveness and the effects of a 'Death Cross.' We are at the same story from last month and July of 2021. To long or to short? #Bitcoin
Over the last week it has been a few breakouts, a few fakeouts, major support turned back into resistance, as well as more indecisiveness and the effects of a 'Death Cross.' We are at the same story from last month and July of 2021. To long or to short? #Bitcoin

137/
As mentioned in 134 & 135/ you saw, as expected:
✅️ a Breakout over the next 24-48 hours.
✅️ Several 'Fakeouts' as the MACD & Signal line were both above the 0 line (temporarily).
✅️ MACD & Signal line cross back below the 0 line.
✅️ A retest of Resistance at $45K.
As mentioned in 134 & 135/ you saw, as expected:
✅️ a Breakout over the next 24-48 hours.
✅️ Several 'Fakeouts' as the MACD & Signal line were both above the 0 line (temporarily).
✅️ MACD & Signal line cross back below the 0 line.
✅️ A retest of Resistance at $45K.

138/
Now what!?
•Expect more 'Fakeouts' as the MACD/Signal line is below the 0 line (again, for now) but soon to peak back into uptrend territory on the daily timeframe.
•Expect to see the price spike as the price of #Bitcoin is Oversold at the current 28.87 RSI rating.
Now what!?
•Expect more 'Fakeouts' as the MACD/Signal line is below the 0 line (again, for now) but soon to peak back into uptrend territory on the daily timeframe.
•Expect to see the price spike as the price of #Bitcoin is Oversold at the current 28.87 RSI rating.

139/
•Expect the 50 day Moving Average (MA) to cross above the 100 day MA over the next weeks or so. This will be the first 'Golden Cross.' It will take more than a month for the next Golden Cross to happen when the 100 day MA crosses back above the 200 day MA. #Bitcoin
•Expect the 50 day Moving Average (MA) to cross above the 100 day MA over the next weeks or so. This will be the first 'Golden Cross.' It will take more than a month for the next Golden Cross to happen when the 100 day MA crosses back above the 200 day MA. #Bitcoin

140/
As mentioned in 138/ you were expected to see:
✅️ More 'Fakeouts' as the MACD/signal line was below the 0 line but peaked back into uptrend territory on the daily timeframe.
✅️ The price spike as the price of #Bitcoin was Oversold at the current 28.87 RSI rating.
As mentioned in 138/ you were expected to see:
✅️ More 'Fakeouts' as the MACD/signal line was below the 0 line but peaked back into uptrend territory on the daily timeframe.
✅️ The price spike as the price of #Bitcoin was Oversold at the current 28.87 RSI rating.

141/
We are still a few more weeks behind the 'Golden Cross' as the 50 day Moving Average (MA) crosses above the 100 day MA as mentioned in 139/.
Over the past week or so you saw the price reach Oversold levels to Overbought levels at 73.48 on the 28th, back to near Oversold.
We are still a few more weeks behind the 'Golden Cross' as the 50 day Moving Average (MA) crosses above the 100 day MA as mentioned in 139/.
Over the past week or so you saw the price reach Oversold levels to Overbought levels at 73.48 on the 28th, back to near Oversold.

142/
Now what?
Expect to see $42K act as support before possibly turning back into resistance. Buying pressure is up but traders will take profits which causes the price to retrace. This $34K-$45K range has been in effect since January 4th. Eventually there will be a breakout.
Now what?
Expect to see $42K act as support before possibly turning back into resistance. Buying pressure is up but traders will take profits which causes the price to retrace. This $34K-$45K range has been in effect since January 4th. Eventually there will be a breakout.

143/
We are just a little ways behind the 'Golden Cross' as the 50 day Moving Average (MA) crosses above the 100 day MA as mentioned in 141/.
Over the past several weeks you saw the price reach near Oversold to Overbought levels over and over again. This is an ongoing battle.
We are just a little ways behind the 'Golden Cross' as the 50 day Moving Average (MA) crosses above the 100 day MA as mentioned in 141/.
Over the past several weeks you saw the price reach near Oversold to Overbought levels over and over again. This is an ongoing battle.

144/
As mentioned in 142/ you saw $42K act as support before turning into resistance then back into current support. $45K is the major resistance that will need to be broken by the Bulls to move outside of the current (since January) trading zone between $32K & $45K.
#Bitcoin
As mentioned in 142/ you saw $42K act as support before turning into resistance then back into current support. $45K is the major resistance that will need to be broken by the Bulls to move outside of the current (since January) trading zone between $32K & $45K.
#Bitcoin

145/
Now what?
As mentioned in 142/ there will be a breakout. Looking at the Indicators on a daily timeframe they all point to a bullish breakout.
•The MACD & SL are both above the 0 line.
•The trend is up and the price is riding the trendline perfectly..
Now what?
As mentioned in 142/ there will be a breakout. Looking at the Indicators on a daily timeframe they all point to a bullish breakout.
•The MACD & SL are both above the 0 line.
•The trend is up and the price is riding the trendline perfectly..

146/
Now what? pt.2
•Over the next 48 - 72 hours expect the results of the imminent breakout.
•Although an Overbought RSI could mean a reversal is imminent, it also could mean heavy buying pressure from the Bulls. This is the only indicator that leaves doubt. Stay tuned. #BTC
Now what? pt.2
•Over the next 48 - 72 hours expect the results of the imminent breakout.
•Although an Overbought RSI could mean a reversal is imminent, it also could mean heavy buying pressure from the Bulls. This is the only indicator that leaves doubt. Stay tuned. #BTC

147/
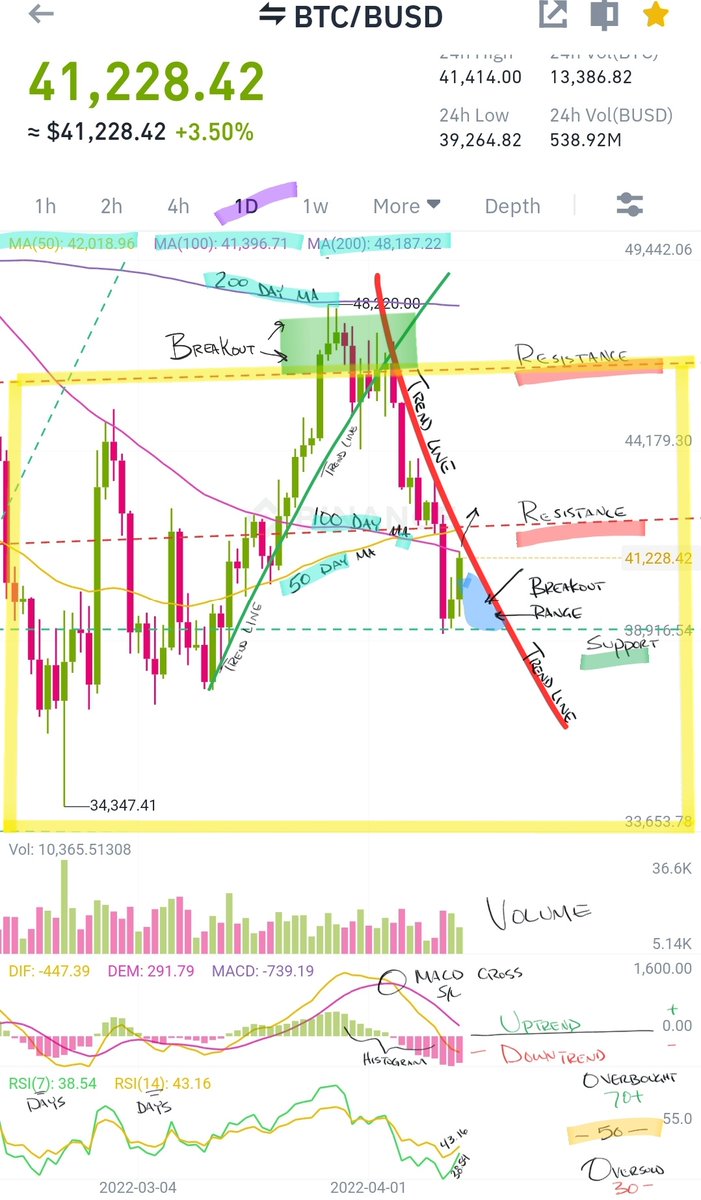
As mentioned 143/ and many earlier Tweets you finally saw the 50 Day MA cross above the 100 Day MA. Typically this is a bullish sentiment but the Market always does the opposite of what most think the price will go based on TA. The anticipation pushed prices higher.
As mentioned 143/ and many earlier Tweets you finally saw the 50 Day MA cross above the 100 Day MA. Typically this is a bullish sentiment but the Market always does the opposite of what most think the price will go based on TA. The anticipation pushed prices higher.

148/
As mentioned in 145/ you saw the Bullish breakout outside of the 3 month long trading range as:
✅️The MACD & SL were both above the 0 line.
✅️The trend is up & the price is riding the trendline perfectly.
2 or more indicators that line up is always good confirmation.
As mentioned in 145/ you saw the Bullish breakout outside of the 3 month long trading range as:
✅️The MACD & SL were both above the 0 line.
✅️The trend is up & the price is riding the trendline perfectly.
2 or more indicators that line up is always good confirmation.

149/
Since the last Tweet entry on March 27th #Bitcoin price broke out of the 3 month range climbing as high as $48,220 on @binance. Price was extremely OVERBOUGHT on all timeframes and you saw and are still seeing retracements. This is perfectly normal as tax season is upon us.
Since the last Tweet entry on March 27th #Bitcoin price broke out of the 3 month range climbing as high as $48,220 on @binance. Price was extremely OVERBOUGHT on all timeframes and you saw and are still seeing retracements. This is perfectly normal as tax season is upon us.
150/
Now what?
Over the next few days you will see #Bitcoin once again, Breakout. Only two scenarios are present:
1: The price climbs and breaks out of the downward trend line.📈
Or
2: The price retraces & trades in the 'blue zone' (see pic) before a Breakout. 📉📈
Now what?
Over the next few days you will see #Bitcoin once again, Breakout. Only two scenarios are present:
1: The price climbs and breaks out of the downward trend line.📈
Or
2: The price retraces & trades in the 'blue zone' (see pic) before a Breakout. 📉📈

151/
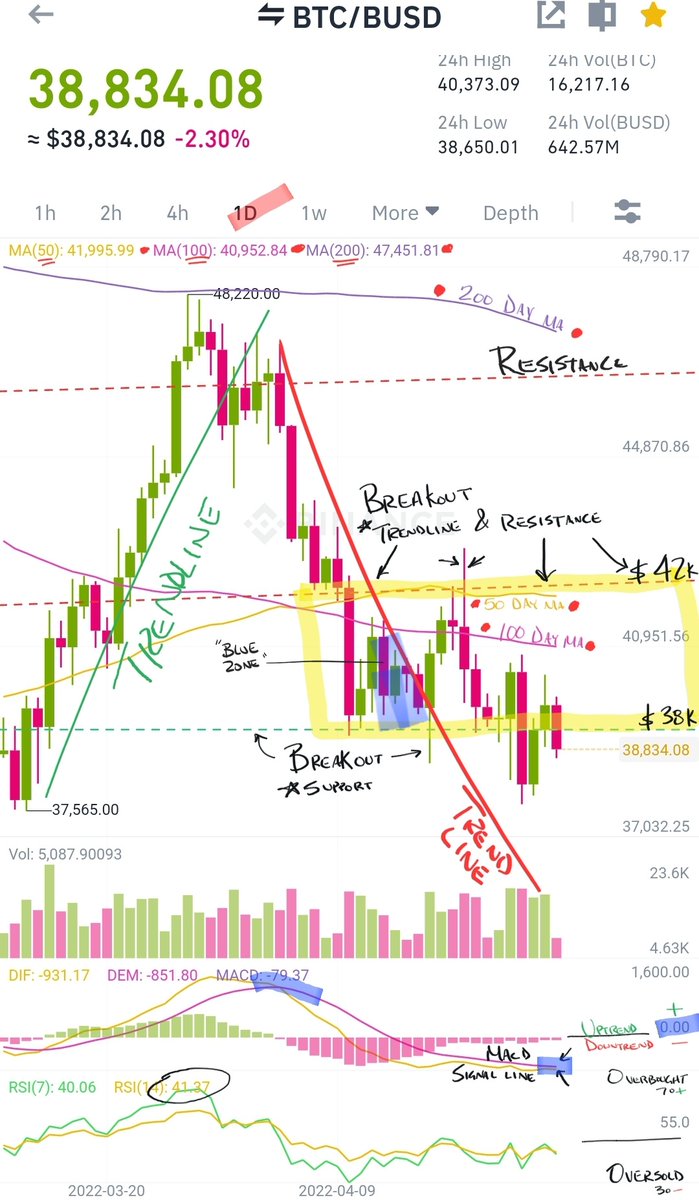
It has been a wild ride as usually over the past few weeks. As mentioned in 150/ you saw 1 of only 2 scenarios. Traders all have the same lines and will mostly trade within. Nonetheless, #Bitcoin traded in the 'blue zone' before breaking out down and then up. (see emoji 😉)
It has been a wild ride as usually over the past few weeks. As mentioned in 150/ you saw 1 of only 2 scenarios. Traders all have the same lines and will mostly trade within. Nonetheless, #Bitcoin traded in the 'blue zone' before breaking out down and then up. (see emoji 😉)

152/
#Bitcoin will always trade in between a range before a breakout onto the next range. $38K to $42K support & resistance range is nothing new. There will be breakouts & fakeouts until the new range is established. Short term support is at $37K while major support is at $32K.
#Bitcoin will always trade in between a range before a breakout onto the next range. $38K to $42K support & resistance range is nothing new. There will be breakouts & fakeouts until the new range is established. Short term support is at $37K while major support is at $32K.
153/
Ok now what?
•Over the next few days or so you can expect the MACD & Signal to finally cross one another after countless fakeouts. Definitely expect a few more.
•The Relative Strength Index or RSI is below 50, near Oversold territory so a spike to Overbought is in order.
Ok now what?
•Over the next few days or so you can expect the MACD & Signal to finally cross one another after countless fakeouts. Definitely expect a few more.
•The Relative Strength Index or RSI is below 50, near Oversold territory so a spike to Overbought is in order.

154/
•The overall Daily trend (as this is a daily chart) is down. Obviously it has to climb out so although the trend is down you can expect price to move higher.
•The Moving Averages or MA's suggest that #Bitcoin is trading below average price. The opposite is soon to happen.
•The overall Daily trend (as this is a daily chart) is down. Obviously it has to climb out so although the trend is down you can expect price to move higher.
•The Moving Averages or MA's suggest that #Bitcoin is trading below average price. The opposite is soon to happen.

155/
What a wild few weeks. As mentioned in 152/ #Bitcoin will always trade in between range before a breakout. In this case you saw a few breakouts & many Fakeouts. Since the last few entries you saw $37K act as support for 5 days before ultimately turning back into resistance.
What a wild few weeks. As mentioned in 152/ #Bitcoin will always trade in between range before a breakout. In this case you saw a few breakouts & many Fakeouts. Since the last few entries you saw $37K act as support for 5 days before ultimately turning back into resistance.

156/
You also saw $32K act as Support for 3 days before a breakout to next support of $28K that was first established January 2021. You also saw a 1 day dip to the next major Support at $24K; which the Bulls quickly took control. Retracements are to be expected in a downtrend.
You also saw $32K act as Support for 3 days before a breakout to next support of $28K that was first established January 2021. You also saw a 1 day dip to the next major Support at $24K; which the Bulls quickly took control. Retracements are to be expected in a downtrend.

157/
As mentioned in 153/ you saw the MACD & Signal line finally cross one another on May 5th but this was followed by yet another fakeout. As mentioned, more were expected but not at the magnitude of $24K. What a dip!! #Bitcoin is very volatility and can be very unpredictable.
As mentioned in 153/ you saw the MACD & Signal line finally cross one another on May 5th but this was followed by yet another fakeout. As mentioned, more were expected but not at the magnitude of $24K. What a dip!! #Bitcoin is very volatility and can be very unpredictable.

158/
The RSI over a 7 day period climbed as high as 54 but it never reached Overbought. Over the next week or so it will. Most indicators have been slightly reset and reconfiguration is necessary. Over the next few weeks it will be difficult to determine the movement using RSI.
The RSI over a 7 day period climbed as high as 54 but it never reached Overbought. Over the next week or so it will. Most indicators have been slightly reset and reconfiguration is necessary. Over the next few weeks it will be difficult to determine the movement using RSI.
159/
As mentioned in 154/ the overall Daily trend is down. It definitely has more climbing out to do but in the end #Bitcoin Bulls will prevail.
Also as mentioned the Moving Averages or MA's suggest that #BTC is trading below average price. Again, the opposite is soon to happen.
As mentioned in 154/ the overall Daily trend is down. It definitely has more climbing out to do but in the end #Bitcoin Bulls will prevail.
Also as mentioned the Moving Averages or MA's suggest that #BTC is trading below average price. Again, the opposite is soon to happen.

160/
As mentioned in 159/ the overall Daily trend is down however within overall uptrends and downtrends you can find temporary sideways trends. Traders really enjoy this low volatility to lock in profits using the 'buy support sell resistance' trading method. #Bitcoin
As mentioned in 159/ the overall Daily trend is down however within overall uptrends and downtrends you can find temporary sideways trends. Traders really enjoy this low volatility to lock in profits using the 'buy support sell resistance' trading method. #Bitcoin

161/
Also as mentioned the price of #BTC is well below all Moving Averages or MA's and soon the price will trade above the MA's as they will soon change making the new Moving Averages slightly lower. The new Average price will be about $30K and not the current $37K on the daily.
Also as mentioned the price of #BTC is well below all Moving Averages or MA's and soon the price will trade above the MA's as they will soon change making the new Moving Averages slightly lower. The new Average price will be about $30K and not the current $37K on the daily.

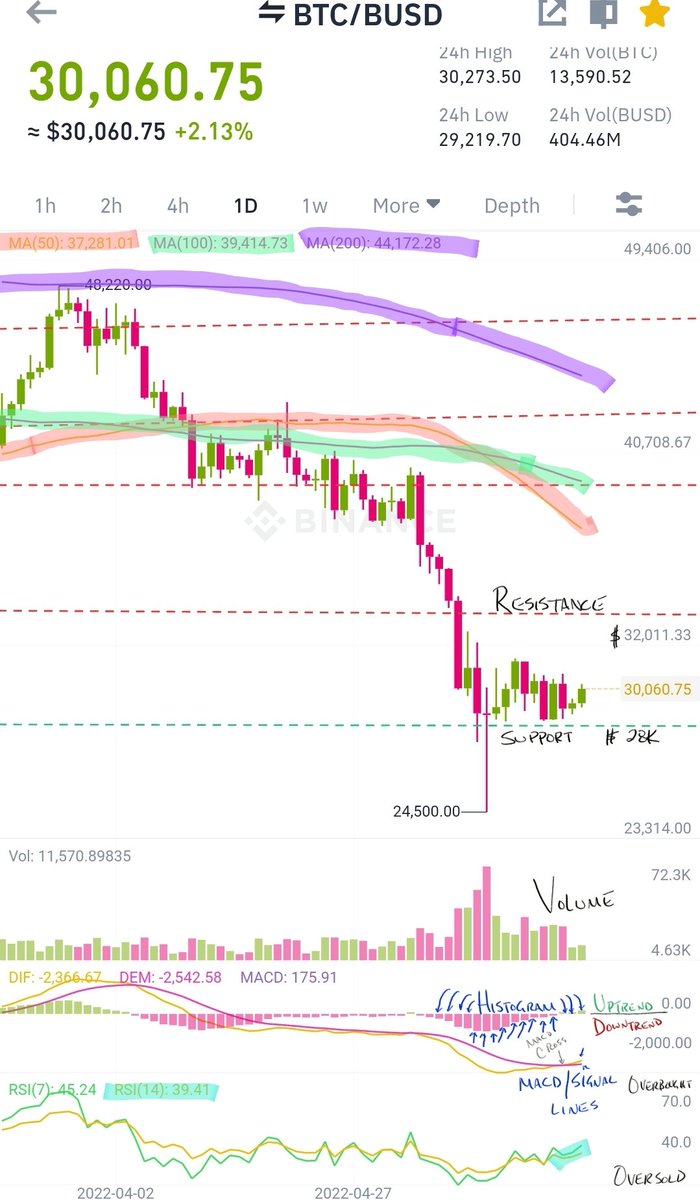
162/
What to watch:
•The MACD/Signal Line. Soon both lines will cross over the 0 line.
•RSI - The current rating is more close to Oversold than overbought. Expect overbought ratings in the near future.
•A breakout/fakeout after price trades in the next trading zone.(see pic)
What to watch:
•The MACD/Signal Line. Soon both lines will cross over the 0 line.
•RSI - The current rating is more close to Oversold than overbought. Expect overbought ratings in the near future.
•A breakout/fakeout after price trades in the next trading zone.(see pic)

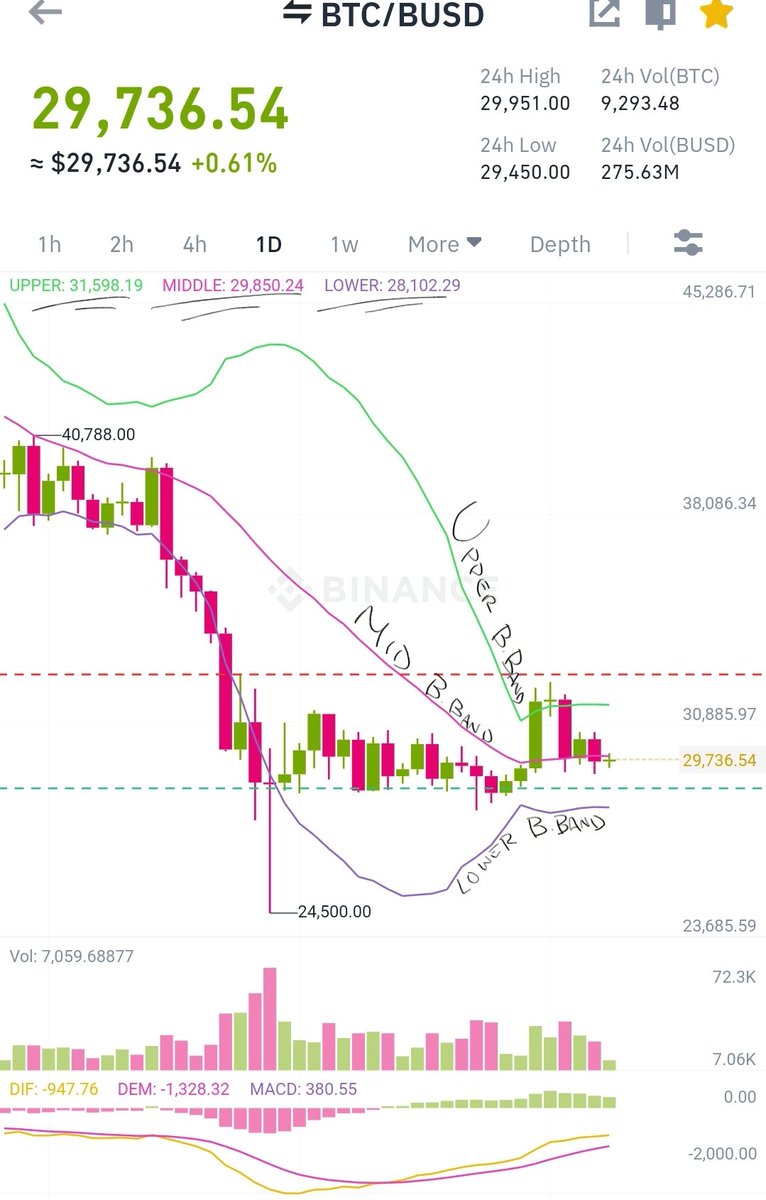
163/
What to watch cont.
•The Bollinger Bands. Price will always trade in between the Bbands before it breaks the Upper or Lower Bands. At this moment the price is below the Mid Bbands. Although this is Bearish, you can always expect the unexpected. #Bitcoin
What to watch cont.
•The Bollinger Bands. Price will always trade in between the Bbands before it breaks the Upper or Lower Bands. At this moment the price is below the Mid Bbands. Although this is Bearish, you can always expect the unexpected. #Bitcoin
@threadreaderapp unroll
• • •
Missing some Tweet in this thread? You can try to
force a refresh