Historic landfall expected. Cyclone #Shaheen is about to strike Oman hard where no recorded cyclone has struck before, especially with this intensity.

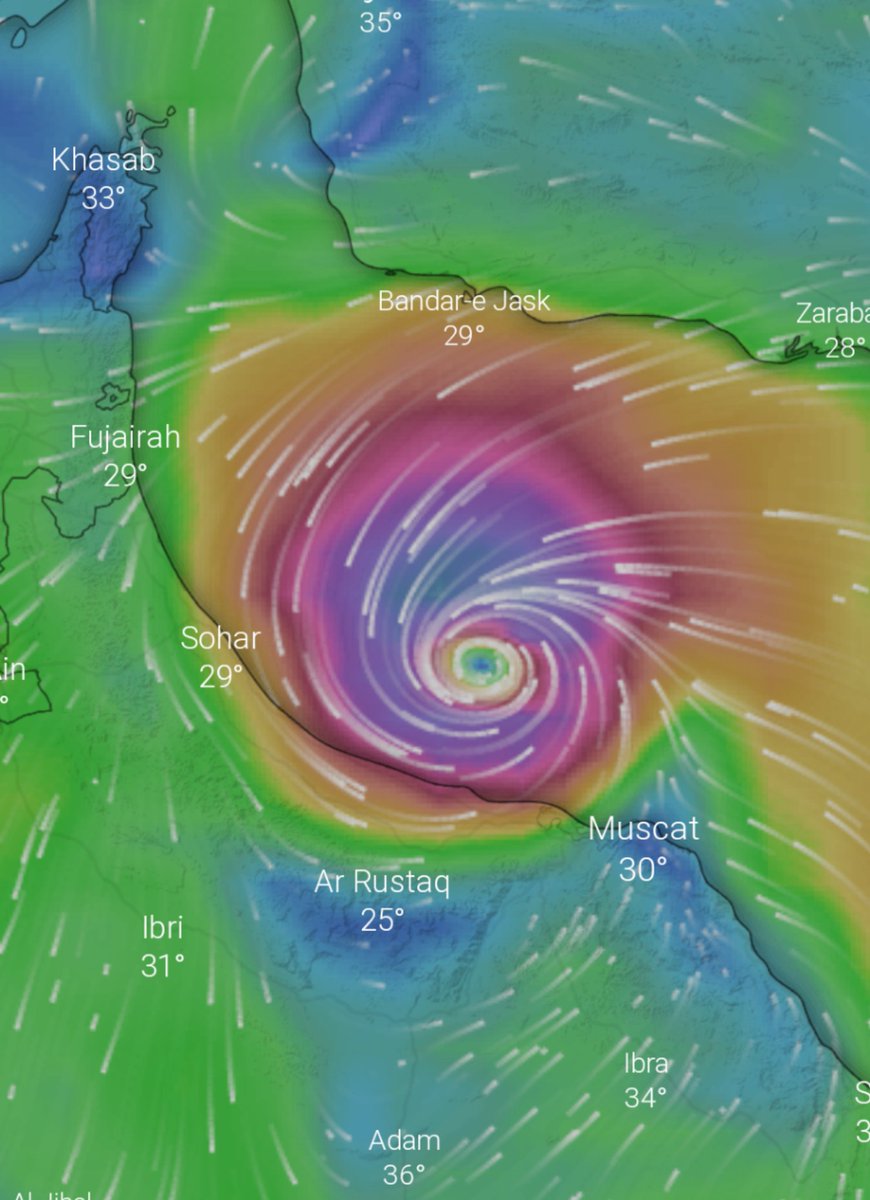
Bizarre looking at a cyclone with an eye feature surrounded by desert.
Some great info in this article, really is unprecedented in modern times.

Notice that Oman has observed strong cyclones before, notable and devastating like Gonu for example.

But we haven't seen one this far west in the Gulf of Oman before.

Really is an unfortunate track through the Gulf of Oman. #Shaheen is able to maintain intensity right until landfall.

• • •

Missing some Tweet in this thread? You can try to force a refresh
 

Keep Current with Scott Duncan

Scott Duncan Profile picture

Stay in touch and get notified when new unrolls are available from this author!

Read all threads

This Thread may be Removed Anytime!

PDF

Twitter may remove this content at anytime! Save it as PDF for later use!

Try unrolling a thread yourself!

how to unroll video
  1. Follow @ThreadReaderApp to mention us!

  2. From a Twitter thread mention us with a keyword "unroll"
@threadreaderapp unroll

Practice here first or read more on our help page!

More from @ScottDuncanWX

3 Oct
We have just observed the hottest (or joint hottest) October days in recorded history for 4 countries.

🇮🇷 Iran 46.0°C (new record)
🇲🇦 Morocco 43.5°C (new record)
🇨🇳 China 38.9°C (tied record)
🇰🇷 South Korea 32.3°C (new record)
More about the South Korean 🇰🇷 record here

More about the record from Iran. This record was tied the day before too

Read 5 tweets
2 Oct
Brutal cold in Antarctica, impressive even for the coldest place on Planet Earth.

The end of September came close to the world record for lowest temperature in October (-80°C).

The all-time cold record is −89.2 °C (−128.6 °F) from Vostok Station on 21 July 1983. Image
In fact, this was the most severe cold season on record for the South Pole.

washingtonpost.com/weather/2021/1…
From the article above,

'The Amundsen–Scott South Pole Station experienced the coldest average temperature for April to September in 2021 on record. This chart displays the average temperature since 1957 in degrees Celsius. (Richard Cullather/British Antarctic Survey)' Image
Read 6 tweets
29 Sep
Wow... A strong meander in the jet stream has allowed exceptional heat (for late September) to intensify over North America.

A staggering 100°F (37.8°C) was recorded as far north as Hazen in North Dakota at 47.3N latitude.
The incredible heat extended well into Canada, well into the 30s Celsius.

Again, staggering for the time of year.
The jet stream adopted a strongly amplified pattern in the days leading up to the most intense heat.

In this scenario, warm sources are able to lift north and intensify over central/northern US and Canada.
Read 4 tweets
21 Sep
Wait for it...

The 7 hottest summers in recorded history have all occurred in the last 7 years.
The last frame as individual images.
I often get asked why I use 1951-1980 average instead of something more recent...

The answer is covered in the FAQs: data.giss.nasa.gov/gistemp/faq/

Also, the baseline period for comparison to 'average' does not affect the underlying data or trend.
Read 6 tweets
19 Sep
The volcanic footage coming out of La Palma in Spain's Canary Islands is just jaw dropping right now 🌋

Previous eruption was 1971 and 1949 before that.

🎥 Via @Armeteo

Many link this volcano back to a documentary and research which hypothesised a potential megatsunami threat in the Atlantic.

This theory is criticised. The wiki page shows many research papers against this idea.

Check out the 'Tsunami scenarios' section.
en.wikipedia.org/wiki/La_Palma Image
This is a nifty graphic showing when and where previous eruptions took place on La Palma, Canary Islands.

Read 4 tweets
19 Sep
Wait for it...

Greenland Sea ice is at its lowest extent in recorded history right now.
The final frame in more detail next to the mapped ice extent and concentration via @NSIDC data.

Notice the median ice edge (1981-2010 average) for this time of year represented by the orange line. ImageImage
Notice the high annual variability. I have plotted last year in yellow just to show how different extent can be year-on-year. Sea ice extent is driven by many factors.

Data available here goes back to the late 1970s.
Read 5 tweets

Did Thread Reader help you today?

Support us! We are indie developers!


This site is made by just two indie developers on a laptop doing marketing, support and development! Read more about the story.

Become a Premium Member ($3/month or $30/year) and get exclusive features!

Become Premium

Too expensive? Make a small donation by buying us coffee ($5) or help with server cost ($10)

Donate via Paypal Become our Patreon

Thank you for your support!

Follow Us on Twitter!

:(