
Finding swing trading setups using Anchored VWAPs and Volume Shelf - A Thread 👇
Anchored VWAP is the average price people paid from a specific anchor in the chart. Bulls and bears do not want stock to cross the average price they paid to buy/sell it!
$SPY $AFRM $V
(1/n)
Anchored VWAP is the average price people paid from a specific anchor in the chart. Bulls and bears do not want stock to cross the average price they paid to buy/sell it!
$SPY $AFRM $V
(1/n)

Let's take an example of a bull run. When a breakout happens, or a reversal happens, or a rally begins, people start buying! We can assume such points as our anchor points!
Now as long as price stays above their average price, they are happy!
But what if it comes down!
(2/n)
Now as long as price stays above their average price, they are happy!
But what if it comes down!
(2/n)
If it comes down, those bulls might start buying again because anytime price will go below the anchored vwap from their initial buy point, they are in loss. THIS IS IMPORTANT!
They do not want to go in loss, so they start buying again pushing the price higher.
(3/n)
They do not want to go in loss, so they start buying again pushing the price higher.
(3/n)
This is useful to know for everyone! Let's also couple this with something called a volume shelf.
Volume shelf shows you areas where most shares were traded. Similar to AVWAP, when price starts to cross below the shelf, bulls will step in because they are going in loss.
(4/n)
Volume shelf shows you areas where most shares were traded. Similar to AVWAP, when price starts to cross below the shelf, bulls will step in because they are going in loss.
(4/n)
Now that we have a rough understanding of what pains bulls on an uptrend, and when do they step in to avoid any losses, we can move ahead.
For a bullish swing trade, our task is to now find setups that are on anchored VWAP supports + volume shelf supports.
(5/n)
For a bullish swing trade, our task is to now find setups that are on anchored VWAP supports + volume shelf supports.
(5/n)
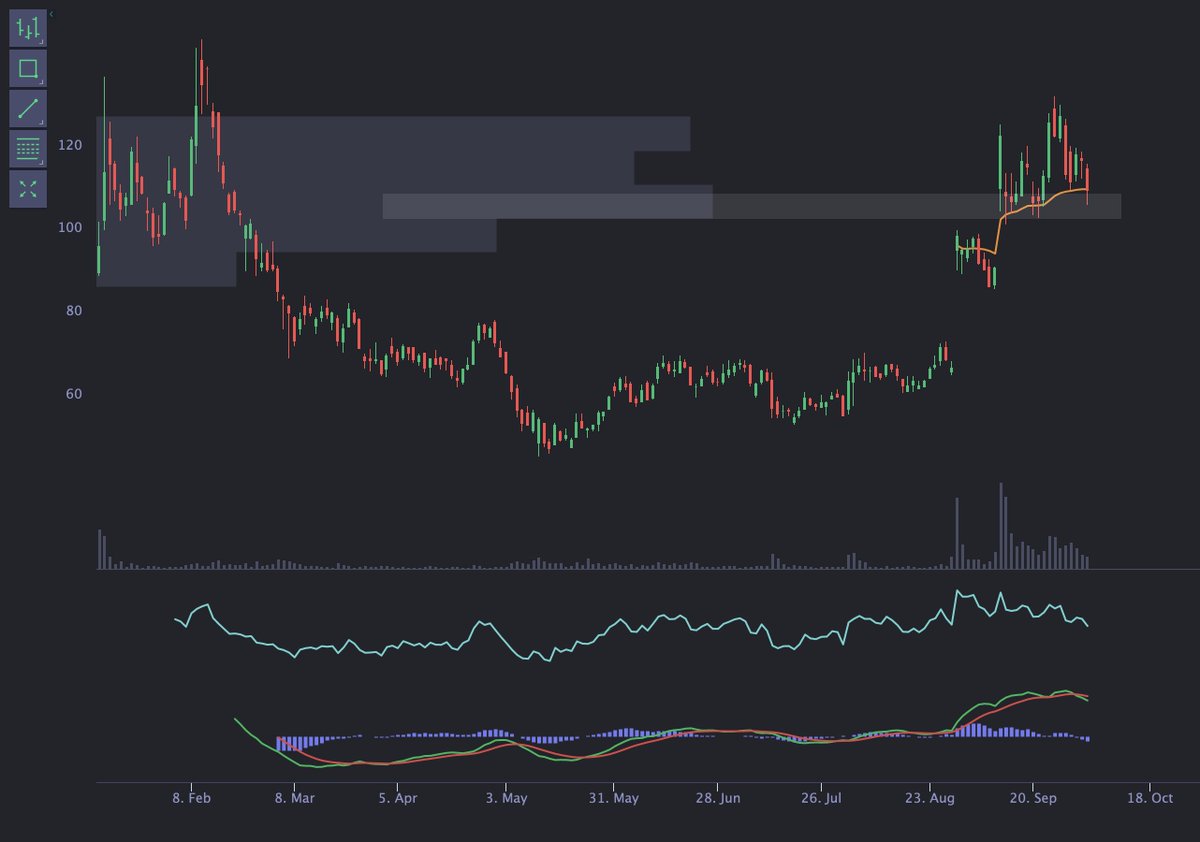
Let's take a look at an example of $AFRM. You can see here that from the gap up AVWAP, we have a support below. We tried to go below it but buyers stepped in and price is above it now.
Same goes to the volume shelf level here! Buyers stepped in.
(6/n)
Same goes to the volume shelf level here! Buyers stepped in.
(6/n)
Let's take a look at another example - $SPY - This is just beautiful 😍
You can see that an AVWAP from every dip's reversal point acts as a support for the next rallies! There's no other indicator that can do this consistently across the entire market! Trust me.
(7/n)
You can see that an AVWAP from every dip's reversal point acts as a support for the next rallies! There's no other indicator that can do this consistently across the entire market! Trust me.
(7/n)

To wrap this up - you need two things for every bullish swing setup. You can reverse this for bearish setups.
1. AVWAP Support from some important level (better if we have multiple AVWAP supports)
2. Volume Shelf support.
The last part is - how do we find these? ❓
(8/n)
1. AVWAP Support from some important level (better if we have multiple AVWAP supports)
2. Volume Shelf support.
The last part is - how do we find these? ❓
(8/n)
For that you can use our "Event AVWAP" on Stocks Dashboard to draw multiple anchored VWAPS and see if you have support levels. $V is an excellent example - so many supports 👇
You can also use "Scany" to just filter for stocks on volume shelf & AVWAP supports.
(9/n)
You can also use "Scany" to just filter for stocks on volume shelf & AVWAP supports.
(9/n)

I hope this is useful for everyone, even if you don't use our platform. Over my 3 years experience, I have not found any technical indicator that works better than anchored VWAP.
If you like this post, please retweet it and give us a follow at @Tradytics
Love you all 🙏😍
(end)
If you like this post, please retweet it and give us a follow at @Tradytics
Love you all 🙏😍
(end)
• • •
Missing some Tweet in this thread? You can try to
force a refresh


