I tweeted #BTC would hit $51.4K yesterday & it did shortly thereafter. What's next?
TLDR:
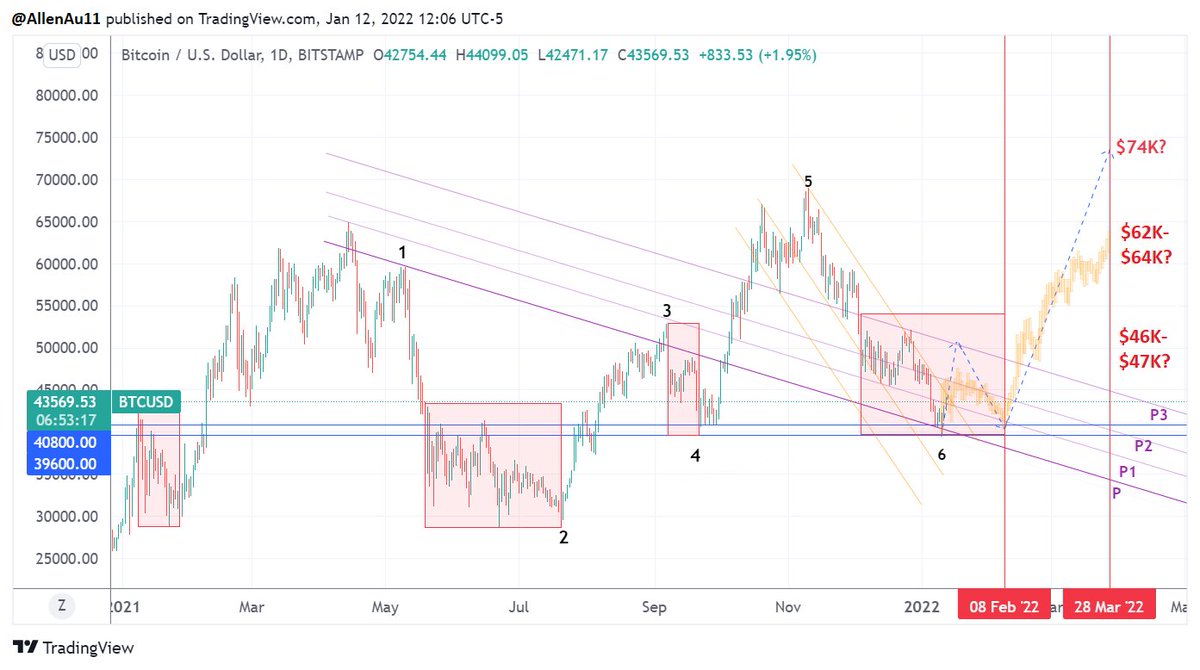
Max. price for this rally is ~$73K. Revisit ATH or even set new ATH by 10/31/21
Why?
-Buy & Sell Oscillator & MRGO-14: Buy
-Futures: Bullish w/ some selling
-Options: Bullish
-TA: Bullish
TLDR:
Max. price for this rally is ~$73K. Revisit ATH or even set new ATH by 10/31/21
Why?
-Buy & Sell Oscillator & MRGO-14: Buy
-Futures: Bullish w/ some selling
-Options: Bullish
-TA: Bullish
1/ MRGO-14 uses the difference in changes in #BTC's market & realized price to find buy/sell signals for BTC.
Green ➡️ Buy
Red ➡️ Sell
MGRO-14 has flipped green since 10/4/21.
Green ➡️ Buy
Red ➡️ Sell
MGRO-14 has flipped green since 10/4/21.

2/ My #BTC Buy & Sell Oscillator has been >1 since 10/5/21.
Simple
Oscillator crosses above 1➡️Buy
Oscillator crosses below 1➡️Sell
Oscillator>2➡️Interim/cycle top
Advanced
Oscillator>1 &📈➡️Buy
Oscillator>1 &📉➡️Take profit
Oscillator<1 &📉➡️Short
Oscillator<1 &📈➡️Take profit
Simple
Oscillator crosses above 1➡️Buy
Oscillator crosses below 1➡️Sell
Oscillator>2➡️Interim/cycle top
Advanced
Oscillator>1 &📈➡️Buy
Oscillator>1 &📉➡️Take profit
Oscillator<1 &📉➡️Short
Oscillator<1 &📈➡️Take profit

3/ On-chain #BTC realized volume in USD shows that the major resistance & support at:
R: $52K/$54K/$56.5K/$57.5K/$58K/$59K
S: $49.5K/$49K/$48.5K/$48K/$47.5K/$46.5K
R: $52K/$54K/$56.5K/$57.5K/$58K/$59K
S: $49.5K/$49K/$48.5K/$48K/$47.5K/$46.5K

4/ #BTC's 21D EMA crossed back above its 34D EMA, which is a bullish sign.
CM Super Guppy has flipped green again, showing signs of strength for BTC's price.
CM Super Guppy has flipped green again, showing signs of strength for BTC's price.


5a. CME #BTC futures annualized premium is double digit positive for October 2021, showing the contango trade is on for US institutions (sell BTC futures & buy spot BTC). Bullish!

5b/ The #BTC perpetual futures liquidations for longs are trending down, while shorts are going up. Bullish!
The funding rates at major exchanges are trending negative, indicating traders are net short. Is this a concern?
The funding rates at major exchanges are trending negative, indicating traders are net short. Is this a concern?

5b/ Whenever there is a spike in -ve funding rates, #BTC's price will increase sharply. This is happening now. Traders are not convinced of the current BTC rally so they are likely to get rekted! Why?
5d/ Large position of #BTC futures longs usually gets liquidated when funding rates go aping +ve. When that turns -ve, we could see a major correction. This is not happening.
If funding rates continue to trend -ve but no major spikes, BTC's price could see downward pressure.
If funding rates continue to trend -ve but no major spikes, BTC's price could see downward pressure.
5e/ #BTC futures OI are building up along with rising BTC's prices. The level to watch is $19B which is the level that lead to the 19% correction in 9/7/21.
But as the funding rates are negative, indicating traders are net short, there's more room for BTC's price to run up.
But as the funding rates are negative, indicating traders are net short, there's more room for BTC's price to run up.

6a/ $1.6B of Deribit #BTC options are expiring on 10/29/21.
Max Pain= $45K
Put/call Ratio= 0.31!!!
The put call ratio indicates traders are extremely bullish about BTC's price in October 2021.
25 delta skew for 7, 30 & 60 days are showing the same bullish trend.
Max Pain= $45K
Put/call Ratio= 0.31!!!
The put call ratio indicates traders are extremely bullish about BTC's price in October 2021.
25 delta skew for 7, 30 & 60 days are showing the same bullish trend.


7a/ Technically, #BTC took out the upper line of repair (LOR) & reached the falling wedge price target of $51.4K. It met resistance & retested the LOR successfully. It should resume up soon. If not trend line #2 should provide good support.
What is the price target?
What is the price target?

7b/ Last time, when #BTC had a major run to its ATH from 11/26/2020, it reached between 1.272 & 1.414 Fib extension. If the same price action repeats, BTC's price could go up to $73K.
What is the timeline for hitting that? Not this month, but November 2021 likely.
What is the timeline for hitting that? Not this month, but November 2021 likely.

7c/ Using trendlines & a pitchfork, it is determined that #BTC is likely to revisit or even surpass its ATH by 10/31/21 as it is at the confluence of the trend line 'a' & one of the pitchfork trend lines.
This is similar to the timing estimated by @therationalroot.
This is similar to the timing estimated by @therationalroot.

• • •
Missing some Tweet in this thread? You can try to
force a refresh