NEW: people obsess over vaccine uptake stats, eagerly comparing one country to others to see which has jabbed the highest share of its population, but what if I told you many — perhaps most — of those stats are wrong?
Time for a thread on bad Covid data and how it can cost lives
Time for a thread on bad Covid data and how it can cost lives
Let’s start with the most obvious sign of the problem:
In several European countries, the share of elderly people who have been vaccinated exceeds 100%.
To state the obvious, this is not possible.
But it’s not just a funny quirk, it has big implications.
In several European countries, the share of elderly people who have been vaccinated exceeds 100%.
To state the obvious, this is not possible.
But it’s not just a funny quirk, it has big implications.
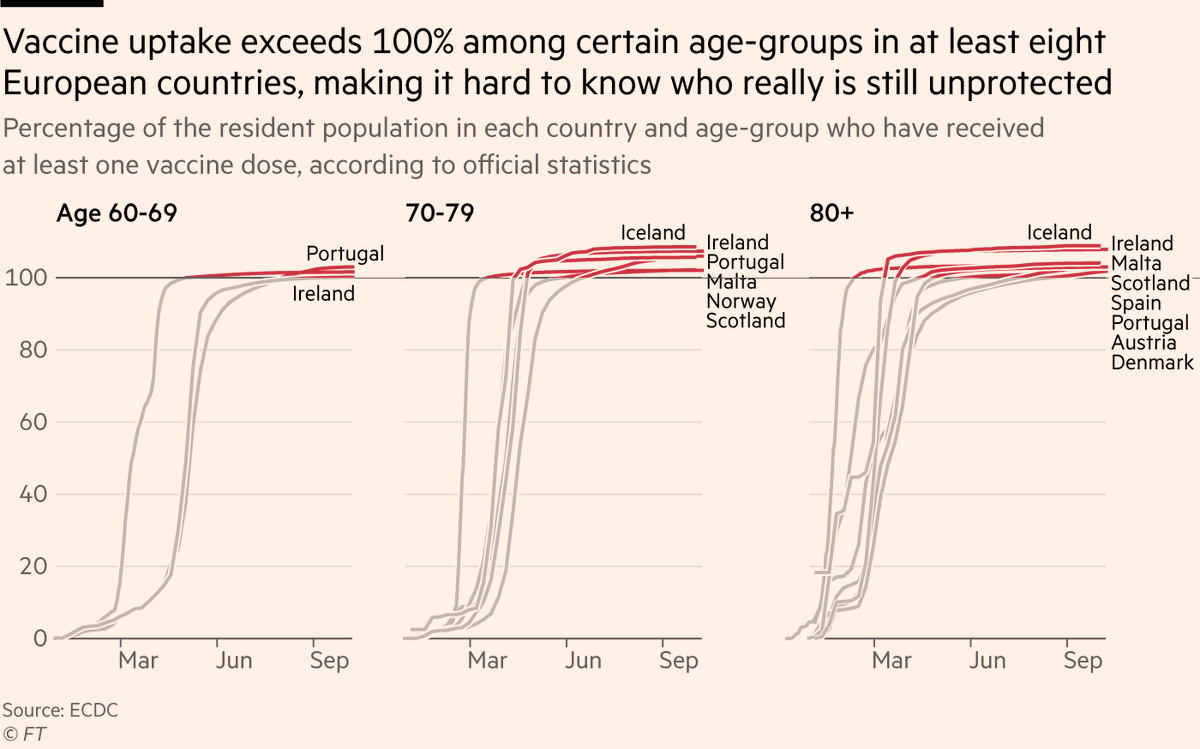
In reality these countries won’t have reached 100%, so there are tens of thousands of unvaxxed elderly that are invisible, and no-one is going to visit someone to make sure they’re jabbed if they think everyone is jabbed.
And this is critically important, because due to their far greater vulnerability, jabbing the last few elderly people will save far more lives than jabbing far larger numbers of kids.

So what’s going on?
It all comes down to population data. In short, most governments don’t know how many people live in their country, so they estimate
Censuses are usually every decade, so right now, ~9 yrs on from the last one in many cases, the estimates are especially shaky
It all comes down to population data. In short, most governments don’t know how many people live in their country, so they estimate
Censuses are usually every decade, so right now, ~9 yrs on from the last one in many cases, the estimates are especially shaky
So what we’re really seeing when vaccine uptake exceeds 100%, is a country discovering it has more people that it thought it did.
But what that means is there could still be thousands of unvaccinated people out there.
But what that means is there could still be thousands of unvaccinated people out there.
When the US decennial census landed last month, it showed there were fewer white people than estimated, and more Asian & Hispanic people.
The result: white vax uptake higher than thought, but there are more unvaxxed Asian and Hispanic people than realised
The result: white vax uptake higher than thought, but there are more unvaxxed Asian and Hispanic people than realised
https://twitter.com/BBGVisualData/status/1438502749977600000
And sticking with the US, it gets worse:
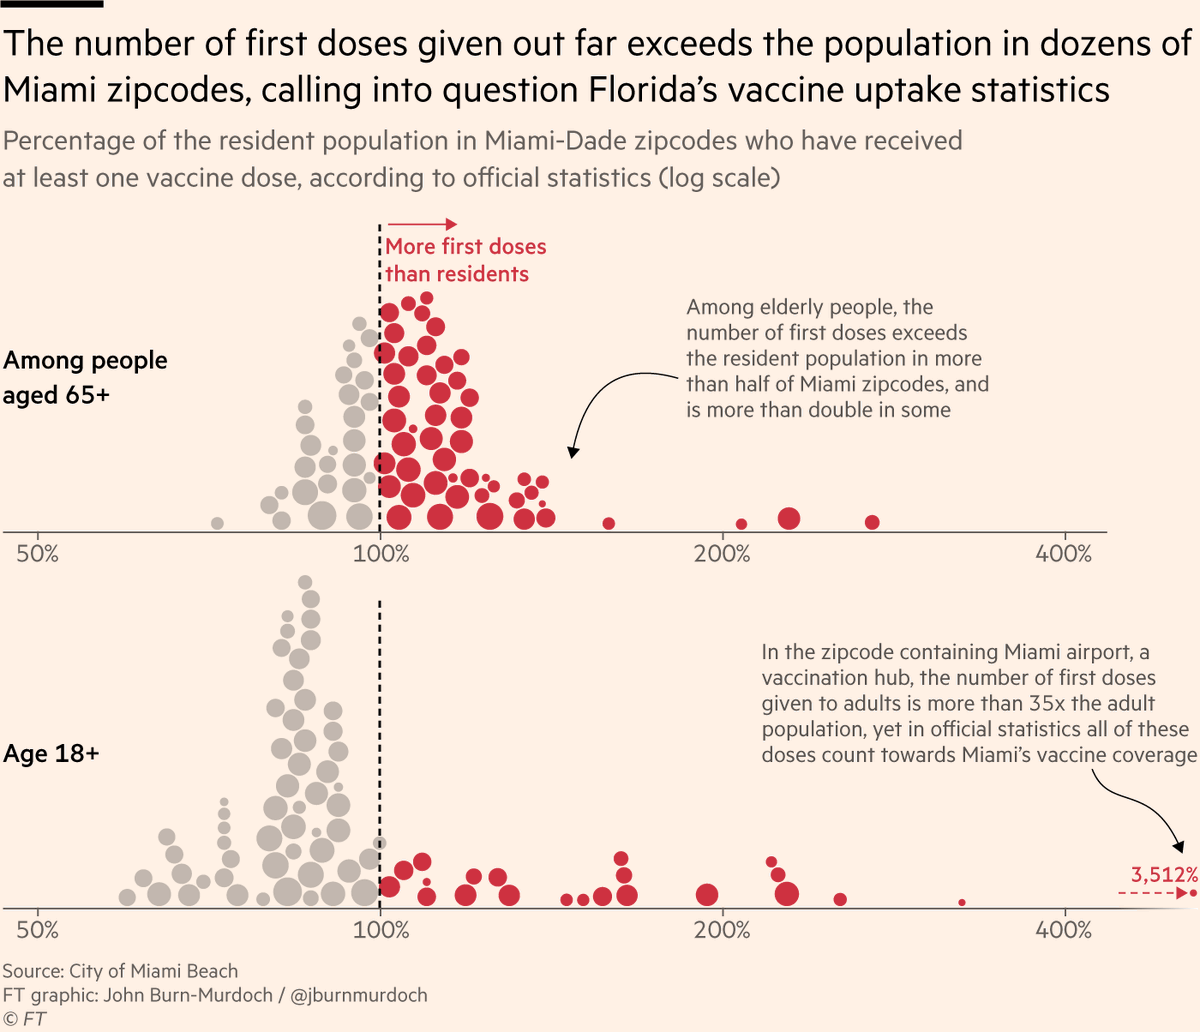
In Florida, vaccine uptake may have been hugely over-stated in official CDC figures, because people who were vaccinated while visiting Florida in winter but usually live elsewhere, have been counted in Florida’s vaccine coverage data.
In Florida, vaccine uptake may have been hugely over-stated in official CDC figures, because people who were vaccinated while visiting Florida in winter but usually live elsewhere, have been counted in Florida’s vaccine coverage data.
In Miami-Dade, vax coverage among over-65s exceeds 100% in *more than half of all zipcodes*, in some cases passing 200%.
This is the "snowbird" effect: thousands of older folks went south to Miami in winter, got jabbed, then returned north
This is the "snowbird" effect: thousands of older folks went south to Miami in winter, got jabbed, then returned north
At the state-level, this causes a major discrepancy:
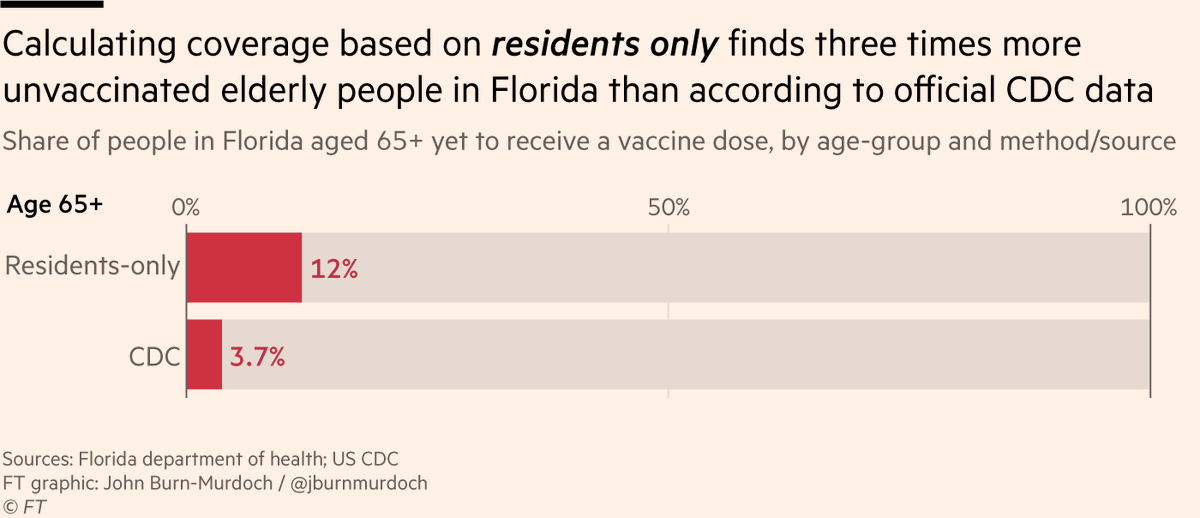
According to CDC data, just 3.7% of people aged 65+ have not yet had any vaccine dose.
But Florida’s department of health, which only includes Florida residents, says 12% of the elderly are still unprotected. More than 3x.
According to CDC data, just 3.7% of people aged 65+ have not yet had any vaccine dose.
But Florida’s department of health, which only includes Florida residents, says 12% of the elderly are still unprotected. More than 3x.
Again, this may just feel like a curious quirk, but it’s a matter of life or death.
As @redouad put it to us, "if we take a step back and imagine this as a new disease and we say that 10 per cent of the population is susceptible vs five per cent, that’s a huge difference"
As @redouad put it to us, "if we take a step back and imagine this as a new disease and we say that 10 per cent of the population is susceptible vs five per cent, that’s a huge difference"
And that’s exactly what played out in Florida.
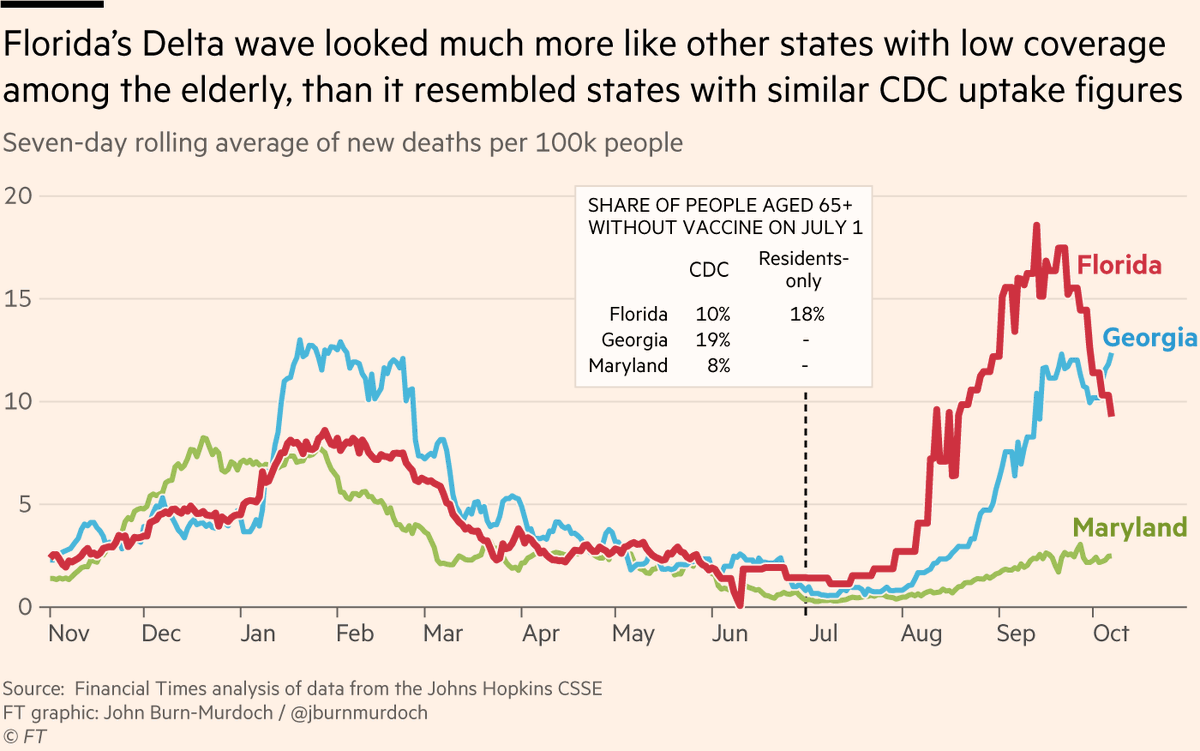
If we trust CDC data, when Delta hit FL its elderly were as well-protected as those in Maryland. Just 10% unvaxxed.
But if we use residents only, its vulnerable elderly pop was twice as big — more like Georgia.
What happened next?
If we trust CDC data, when Delta hit FL its elderly were as well-protected as those in Maryland. Just 10% unvaxxed.
But if we use residents only, its vulnerable elderly pop was twice as big — more like Georgia.
What happened next?
FL had a brutal wave, setting records for deaths. It looked much more like Georgia than Maryland, whose Delta wave has been much more muted.
As Miami Beach mayor @MayorDanGelber put it, the official data created a false sense of security in Florida, quite possibly contributing to people behaving less cautiously.
And the population denominator issue isn’t just a problem for vax uptake.
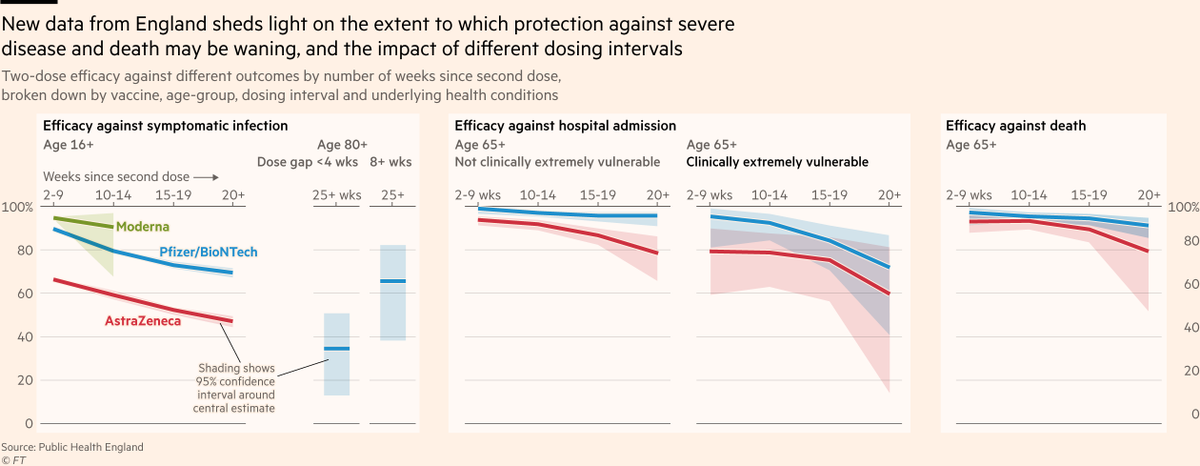
Here in England, anti-vax activists have been circulating data published by @UKHSA which appears to show case rates are higher among fully-vaxxed people than among the unvaxxed 🚨❓
Here in England, anti-vax activists have been circulating data published by @UKHSA which appears to show case rates are higher among fully-vaxxed people than among the unvaxxed 🚨❓
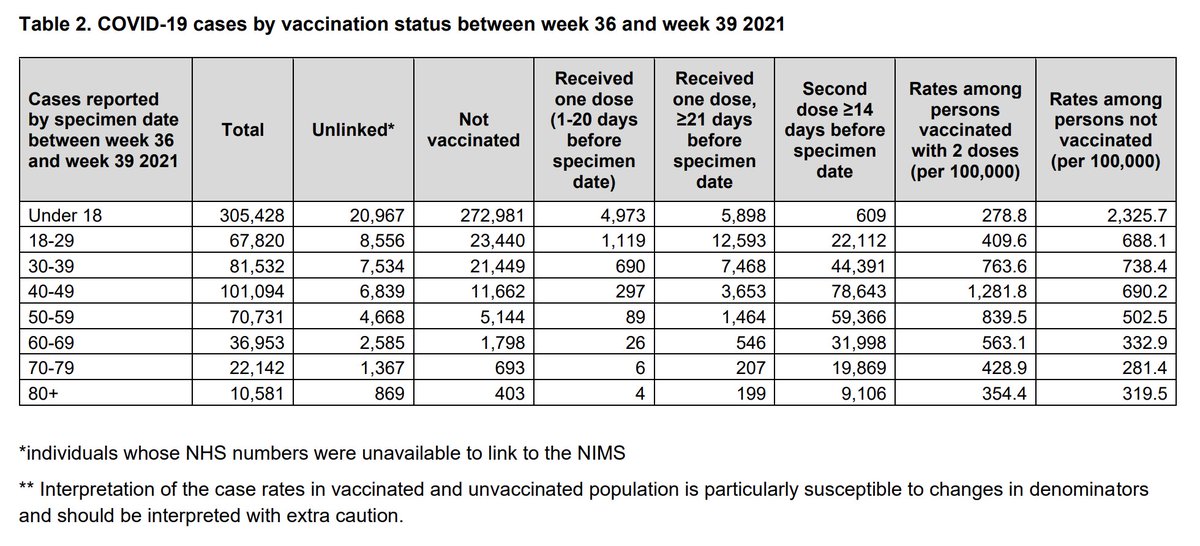
But once again, this is due to misleading population data. NIMS — the system used by UKHSA — is known to double-count large numbers of working-age adults.
The result is NIMS thinks there are far more unvaxxed people than there are, pushing unvaxxed case rates artificially low.
The result is NIMS thinks there are far more unvaxxed people than there are, pushing unvaxxed case rates artificially low.
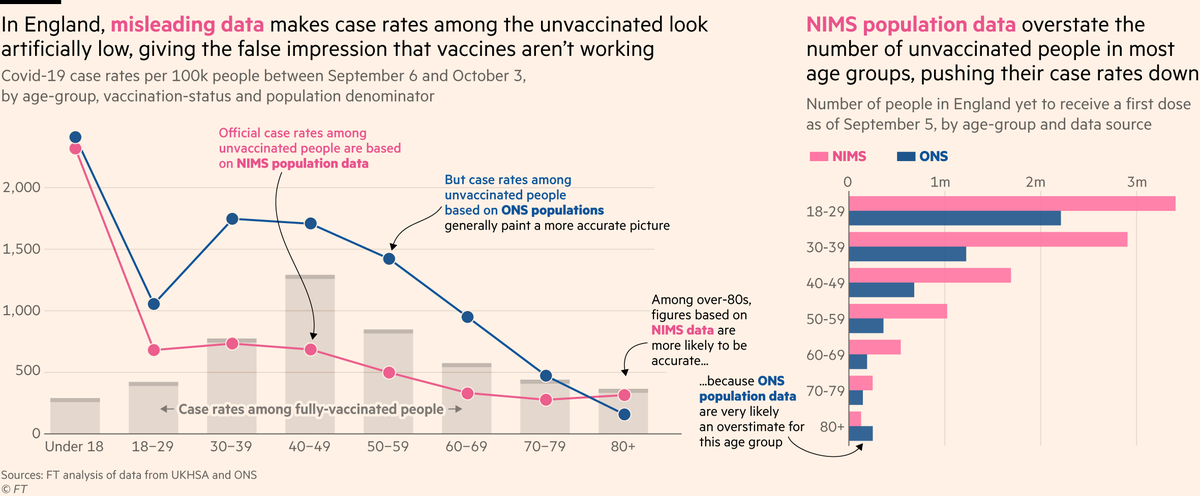
When you use the @ONS’ population estimates, which — while still just that, estimates — don’t suffer the same double-counting flaw, it turns out that in all of those age-groups, the unvaxxed are actually much more likely to get Covid than the vaxxed, as we would expect.

There are still quirks — among the most elderly, the roles are reversed and ONS almost certainly overstates the population size, pushing unvaxxed case rates too low — but the persistent use of NIMS data, known to produce these misleading outcomes — is puzzling, to put it mildly.
So with that, here is the full version of our deep dive into the thorny issue of denominators, and the problems they can cause, from me and @mroliverbarnes ft.com/content/125fba…
And to conclude, here are 5 key take-aways:
1) National vax uptake figures could be out by ~2-5% in many cases, and among some subgroups the discrepancies will be much greater
2) So please stop eagerly saying country X is beating country Y because its uptake is 2-3% higher
1) National vax uptake figures could be out by ~2-5% in many cases, and among some subgroups the discrepancies will be much greater
2) So please stop eagerly saying country X is beating country Y because its uptake is 2-3% higher
3) Be especially careful when countries use markedly different denominators. e.g English stats are usually published using NIMS denominators (so will under-state uptake), while Scotland uses ONS (and is known to over-state uptake, at least in some age-groups).
4) Pay very careful attention to methodology and footnotes. Does the data you’re looking at include residents-only, or could it suffer from Florida’s snowbird problem?
And finally
5) Small errors in uptake rates can have huge impacts. The difference between 85% vaxxed and 95% vaxxed is better expressed as 15% vulnerable vs 5% vulnerable, i.e triple the death toll.
5) Small errors in uptake rates can have huge impacts. The difference between 85% vaxxed and 95% vaxxed is better expressed as 15% vulnerable vs 5% vulnerable, i.e triple the death toll.
Addendum:
As @fedetiberti points out, we see the same thing in several Latin American countries like Argentina and in particular Peru, where in some instances vaccine uptake is in the 130%-140% range
As @fedetiberti points out, we see the same thing in several Latin American countries like Argentina and in particular Peru, where in some instances vaccine uptake is in the 130%-140% range
https://twitter.com/VacunasPeru/status/1447578673738100744
Oh, and I really can’t end this without a shout-out to fellow Denominator Crusaders @PaulMainwood @VictimOfMaths @JamesWard73 and probably many many others. We’ve been banging on about this for several months.
• • •
Missing some Tweet in this thread? You can try to
force a refresh