The new @IEA 2021 World Energy Outlook provides more evidence that the world has moved away from high-emissions scenarios where coal powers the 21st century. We still have a long way to go to meet Paris Agreement goals, but are making real progress: thebreakthrough.org/blog/iea-repor… 1/12
The IEA WEO 2021 makes a number of notable changes to its scenarios. It extends its scenarios out to 2050 (vs 2040 in prior reports), and adds a new "announced pledges scenario" (APS) to model mid-century net-zero pledges that have proliferated over the past year. 2/
Heres a comparison of current policy (CPS), stated policy (STEPS), and announced pledges (APS) scenarios over time in the WEO. Note that IEA retired their CPS scenario after 2019, arguing that the world was moving too quickly for a current policy scenario to be of much use. 3/
The new STEPS 2021 scenario shows a greater near-term rebound in emissions relative to the STEPS 2020 scenario, reflecting more optimistic economic recovery and slower near-term decarbonization projections as the COVID-19 pandemic abates. 4/
STEPS 2021 has global emissions surpassing their prior 2019 record in 2022 and peaking in 2026 before entering a long and slow decline. Emissions in 2040 are projected to be modestly lower – by around 1 GtCO2 – than in STEPS 2020. 5/
The new APS 2021 scenario, by contrast, has global emissions never recovering to their pre-pandemic 2019 levels, and falling by nearly 40% by the year 2050. In this case, my colleague @TedNordhaus would actually win his bet: longbets.org/848/ 6/
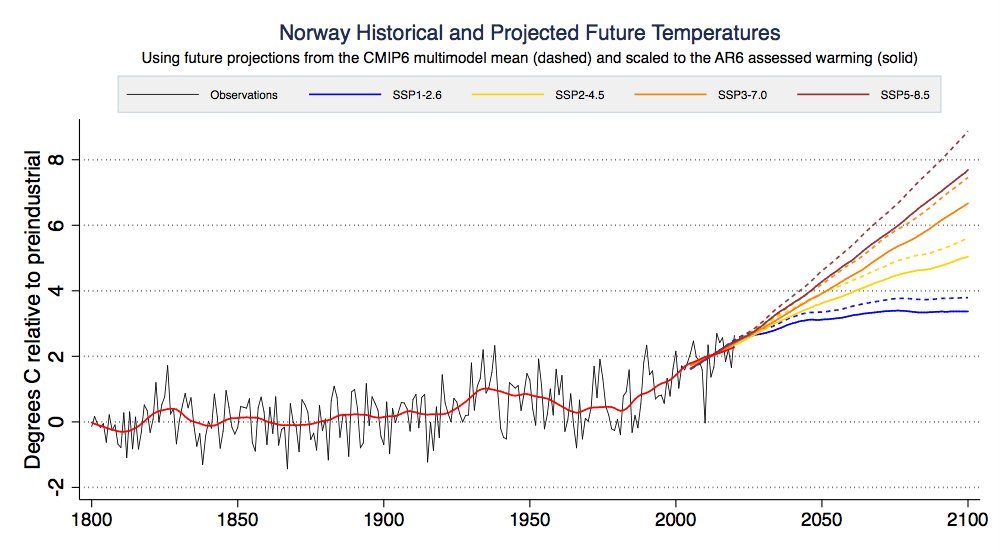
We can compare these IEA current and stated policy scenarios to the emissions scenarios (SSPs) featured in the recent IPCC 6th Assessment report. Here we see that the IEA scenarios are generally at or below SSP2-4.5 levels through 2040/2050, while APS is identical to SSP1-2.6: 7/
None of the IEA scenarios are remotely close to SSP3-7.0 or SSP5-8.5 outcomes. While IEA scenarios represent neither a ceiling nor a floor on possible future emissions, they make it clear that – at least today – the world is no longer headed toward very high emissions futures. 8/
Finally, we can convert these emissions scenarios into likely future warming outcomes. While the IEA only readily provides future CO2 emissions, we can use the fact that warming is broadly proportional to cumulative CO2 emissions to provide a reasonably accurate assessment. 9/
Specifically, I used the difference between 2020-2100 cumulative emissions in each IEA scenario and SSP2-4.5 – along with the IPCC's 5th, 50th, and 95th percentile TCRE values – to calculate warming. This effectively uses SSP2-4.5 value for non-fossil CO2 forcings. 10/
The results are in this figure, which shows cumulative fossil CO2 emissions from 2020-2100 for each scenario, as well as a mean estimate of warming in 2100 relative to preindustrial and the 5th and 95th percentile warming ranges consistent with IPCC AR6 values. 11/
For more details about the report and analysis of its scenarios, see the blog post linked in the initial tweet, as well as my @CarbonBrief colleague @DrSimEvans's post today: carbonbrief.org/fossil-fuel-us… 12/

• • •

Missing some Tweet in this thread? You can try to force a refresh
 

Keep Current with Dr. Zeke Hausfather

Dr. Zeke Hausfather Profile picture

Stay in touch and get notified when new unrolls are available from this author!

Read all threads

This Thread may be Removed Anytime!

PDF

Twitter may remove this content at anytime! Save it as PDF for later use!

Try unrolling a thread yourself!

how to unroll video
  1. Follow @ThreadReaderApp to mention us!

  2. From a Twitter thread mention us with a keyword "unroll"
@threadreaderapp unroll

Practice here first or read more on our help page!

More from @hausfath

12 Oct
Interesting op-ed on geoengineering today by @coralsncaves and @MichaelEMann. Unfortunately, I have to disagree with their suggestion that negative emissions technologies (NETs) are "unlikely to make a meaningful dent in atmospheric CO2". thehill.com/opinion/energy…

A thread: 1/14
In the article they note that IPCC scenarios that peak warming at 1.5C by mid-century later involve substantial drawdown of atmospheric CO2 that prevents further increases in surface temps and is followed by global-scale cooling after emissions go negative. 2/
This is broadly accurate; for example, the new SSP1-1.9 scenario overshoots mid-century resulting in around 1.6C warming, before falling back to 1.4C by 2100 though a very aggressive deployment of net-negative emissions: 3/
Read 14 tweets
4 Oct
Oil and gas prices have been skyrocketing in recent months. This is effectively a carbon price – and a pretty high one at $67 per ton CO2 for oil and $62 per ton for gas relative to January 1st 2021 prices – but only as long as prices don't fall: nytimes.com/2021/10/04/bus…
Note that while expensive oil and gas can make clean energy alternatives more cost-competitive, there are real equity impacts on poor households for whom energy is a non-trivial part of their budget.
My assumptions (in case its helpful):

oil_price = 77 - 48. //dollars per barrel
oil_carbon = 0.43080 //tons per barrel

gas_price = 6 - 2.6 //dollars per million btu
gas_carbon = 0.0544311 //tons per million btu
Read 4 tweets
3 Oct
A number of folks have argued that warming will happen faster than we expect because scientists are not accounting for falling emissions of planet-cooling aerosols as we reduce fossil fuel use. This is not the case – all our future scenarios account for rapid aerosol declines:
Aerosols currently cool the world by around 0.5C (with a fairly large uncertainty). This figure from the recent IPCC AR6 shows the warming since preindustrial times associated with each different factor that contributes to climate change:
In both scenarios consistent with current commitments (SSP2-4.5) and deep mitigation (SSP1-1.9 and SSP1-2.6), cooling from aerosols is cut by 4/5ths, down to ~0.1C by 2100. Most of this reduction happens in the next few decades:
Read 12 tweets
29 Sep
If the proposed Clean Energy Performance Program becomes law it will severely penalize utilities for closing existing nuclear plants. We estimate that closing the Diablo Canyon plant would cost PG&E somewhere between $500 million and $1.5 billion: thebreakthrough.org/issues/energy/…
CEPP awards utilities with a payment of $150 per MWh for an increase in year-over-year clean energy generation of over 1.5 percentage points if the total increase year-over-year exceeds 4 percentage points.
For example, if a utility had 20% of the electricity generation from clean sources in 2022, and increased that to 24% in 2023, they would be eligible for a payment of $150 per MWh for 2.5% (4% minus 1.5%) of their total generation.
Read 13 tweets
28 Sep
We are setting the stage for a lot of confusion given differences in the future warming projections in the IPCC AR6 and the latest generation of models (CMIP6). For example, here are future projections for Norway from CMIP6 (dashed) and scaled to AR6 assessed warming (solid):
Right now most folks doing assessments would use the dashed lines, even though they are inconsistent with the best estimate of warming in the AR6. This is because there is currently not any gridded future warming projections available that are consistent with AR6 assessed warming
The AR6 took a novel (and I think improved) approach to future warming projections. Rather than simply using the CMIP6 mean, they used three different weighted CMIP6 estimates – with weights based model agreement with observed temperatures over the past few decades.
Read 8 tweets
13 Sep
As the world adopts climate policies and the price of clean energy falls, we have and will continue to move away from some of the worst climate outcomes of 4C+ warming. But this should not distract us from our ultimate goal of getting emissions to net-zero thewellnews.com/in-the-news/we…
A decade ago the world seemed on track for a very dark climate future. Global emissions were increasing at 3% per year, China was building a new coal plant every three days, and the idea that emissions could double or triple by 2100 did not seem that far-fetched.
Today things have changed markedly. Global coal use peaked back in 2013, and the International Energy Agency’s (IEA) most recent World Energy Outlook suggests that coal is now in “structural decline.” Global emissions are still increasing, but at a rate of only 1% per year.
Read 15 tweets

Did Thread Reader help you today?

Support us! We are indie developers!


This site is made by just two indie developers on a laptop doing marketing, support and development! Read more about the story.

Become a Premium Member ($3/month or $30/year) and get exclusive features!

Become Premium

Too expensive? Make a small donation by buying us coffee ($5) or help with server cost ($10)

Donate via Paypal Become our Patreon

Thank you for your support!

Follow Us on Twitter!

:(