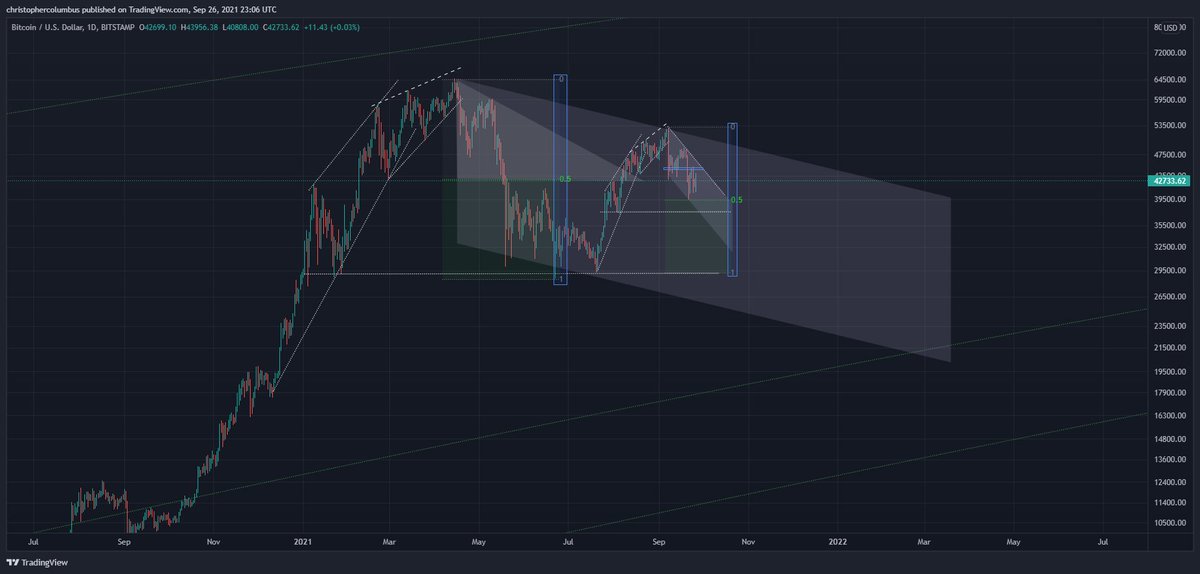
A few more weeks, and you'll have the longest correction within what most term as a cyclical/ bull run up. Portending a double-top?
This would also work in with the absence of a blow-off top that confounded so many. This kind of new price action may reflect an increasingly liquid and maturing market...
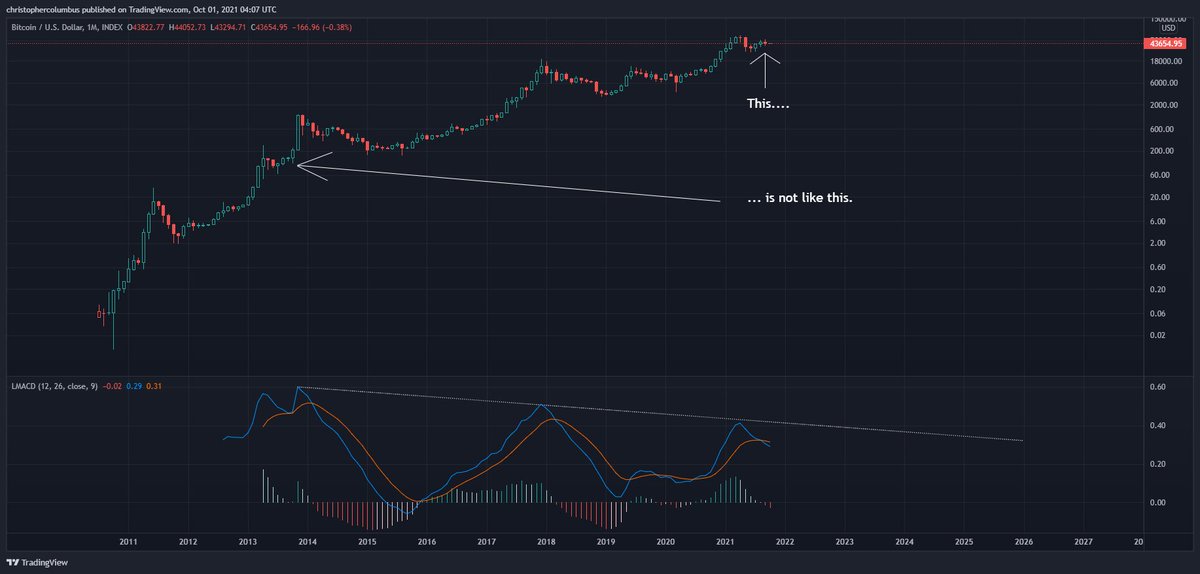
Model of the LGC primarily. Add to that, the consolidating monythly MACD, and reasonable to think double top.
The key here is the macro imo. And that is summed up in 'diminishing everything' - diminishing returns, diminishing cycles, diminishing 'bear markets' and, most significantly here, diminishing volatility. All of this as BTC is capitalized and heads toward price discovery in...
... an increasingly liquid market. The basic principle is increased liquidity = decreasing volatility. Those lacking these macro concepts are all at sea.🙂

• • •

Missing some Tweet in this thread? You can try to force a refresh
 

Keep Current with dave the wave🌊

dave the wave🌊 Profile picture

Stay in touch and get notified when new unrolls are available from this author!

Read all threads

This Thread may be Removed Anytime!

PDF

Twitter may remove this content at anytime! Save it as PDF for later use!

Try unrolling a thread yourself!

how to unroll video
  1. Follow @ThreadReaderApp to mention us!

  2. From a Twitter thread mention us with a keyword "unroll"
@threadreaderapp unroll

Practice here first or read more on our help page!

More from @davthewave

11 Oct
On the basis of TA, you can not become a stubborn bull or a bear in the shorter term if that TA also has invalidation levels baked into it. If it's invalidated, it's invalidated, time to move on.
Those that either harp on about it being invalidated on the one hand, or cling on to their [short term] bull or bear mindset on the other are all TA illiterates.🙂
Once shorter term TA is invalidated, analysts unsurprisingly have two recourses open to them - 1] draw another shorter term TA, whilst also continuing to look at the longer term TA, or a model if available to them. Contrary to some of my posts, this is simple stuff.🙂
Read 10 tweets
2 Oct
Good to see some starting to get it. In an increasingly mature/ increasingly liquid market, nice neat multi-year cycles are dinosaurs. A 'lengthened' cycle also makes no sense in this scenario. Indeed, why talk of 'cycles' anymore [in referring to price development]?
Cycle theory was the product of quant analysis. In contrast to a strictly quantitative approach, you've now got considerations of 'qualitative' differences in the market - a maturing market is a qualitatively different market to what came earlier. More of a macro idea.
Read 5 tweets
1 Oct
Monthly MACD monster well and truly crossed now. It looks scary, but the MACD is lower than previous, and continues down once the bottom is in. A possible scenario with price bottoming at the end of the quarter.
This chart should show it increasingly unlikely that the current price action is comparable to 2013.
If a scenario something like this played out, it would in no way break Bitcoin [which I'm very bullish on... corrections and all]. It would only break models and theories such as s2f, 4 year cycle, and lengthening cycle.
Read 5 tweets
28 Sep
Choose a method, all of which are different. But what they have in common is a criteria by which they could be invalidated. This is what makes them respectable.... their readiness to be wrong.
And then you have the - 'it could go up or down'. No matter how respectable it sounds, without this criteria of invalidation, without a solid prediction, you just have pseudo-scientific nonsense.
Run a mile from anyone who dances around or dodges this [criteria of invalidation], for their fear of being wrong only goes to show they don't understand the nature of TA, modeling, and theory... they don't even have a proper theory.
Read 4 tweets
26 Sep
With the fractal largely having played out, time to move on. New short term chart, i.e.; more speculative than the longer-term charts. Image
'More speculative on the short-term' means half expect it to be wrong. Why chart it then? It maps out a *real* possibility. Consider it a stress- test, and risk management TA.
Read 4 tweets
23 Nov 19
New thread now that 6.7K was hit. In the buy zone where people should be averaging in imo. Will it go lower than 6.7K? May well do, but I wouldn't be betting on it. Next few posts will look at the various elements of support I'm seeing

Previous thread:
1/ Probably the simplest and most straightforward one - long term moving averages.

Price comes down hard finding support at the 4 year moving average [48 MMA], bounces and then finds support at the 3 year MA [36 MMA].
2/ The momentum indicator of the weekly Gaussian channel is interesting - turned green, moving up, and looking bullish. Much of my TA is momentum based, which I see as having both leading and lagging indicators to it - useful if it works.
Read 8 tweets

Did Thread Reader help you today?

Support us! We are indie developers!


This site is made by just two indie developers on a laptop doing marketing, support and development! Read more about the story.

Become a Premium Member ($3/month or $30/year) and get exclusive features!

Become Premium

Too expensive? Make a small donation by buying us coffee ($5) or help with server cost ($10)

Donate via Paypal Become our Patreon

Thank you for your support!

Follow Us on Twitter!

:(