dave the wave🌊🌓 Profile picture
Charts/ BTC investment/ Altcoin Trading/ Articles. https://t.co/hjVaoGbgCS Articles only - https://t.co/Nj3rWvBzWh
comma Profile picture LPDTP Profile picture Paneer Papi Profile picture duongdung🔺 Profile picture 5 subscribed
Mar 31, 2023 4 tweets 2 min read
Latest article just published. Also now on audio.

Make sure to sign up or subscribe~~

Modeling the Long Game - How can the LGC in BTC/ USD Plateau while USD Hyper-Inflates? , by @davthewave open.substack.com/pub/davethewav… "Most of us are familiar with the memes for a stupendous BTC price, whether decked out in all the splendour of scientific garb, such as s2f was, or whether just a blatant and conscious meme, such as the recent call for 1 million BTC in 90 days.
Nov 21, 2022 10 tweets 2 min read
What typifies the times is the lengths people will go to in order to avoid 'cognitive dissonance'.

Yet hedging, where you willingly entertain the exact opposite of your investment thesis, is exactly that.... the avoidance of an insular cognitive closure.🧐 I think this is why hedging, as a practical activity, is so difficult for some today... for they've first preferred a doctrinaire approach that tends to be hermetically sealed from reality.
Nov 20, 2022 4 tweets 2 min read
Apr 24, 2022 9 tweets 2 min read
#BTC risk on or risk off?

If you consider BTC an asset, you'll always be plagued by this question.

If you consider BTC an alternative currency [in the process of capitalization], the question loses its bite.

davethewave.substack.com/p/bitcoins-log… "The way out of this dilemma, insofar as it involves investing in Bitcoin or not, is to re-think what Bitcoin actually is from a macro-economic perspective. If Bitcoin can be habilitated to both inflationary and deflationary narratives [arguably opposite sides of the same crisis
Feb 18, 2022 7 tweets 3 min read
The LGC channel, MACD, and RSI all signaling the bottom to be put in over the next few months. Image Updated. Image
Dec 4, 2021 7 tweets 2 min read
It may not be pretty, but it is technical/ risk analysis. A H&S possibility... 
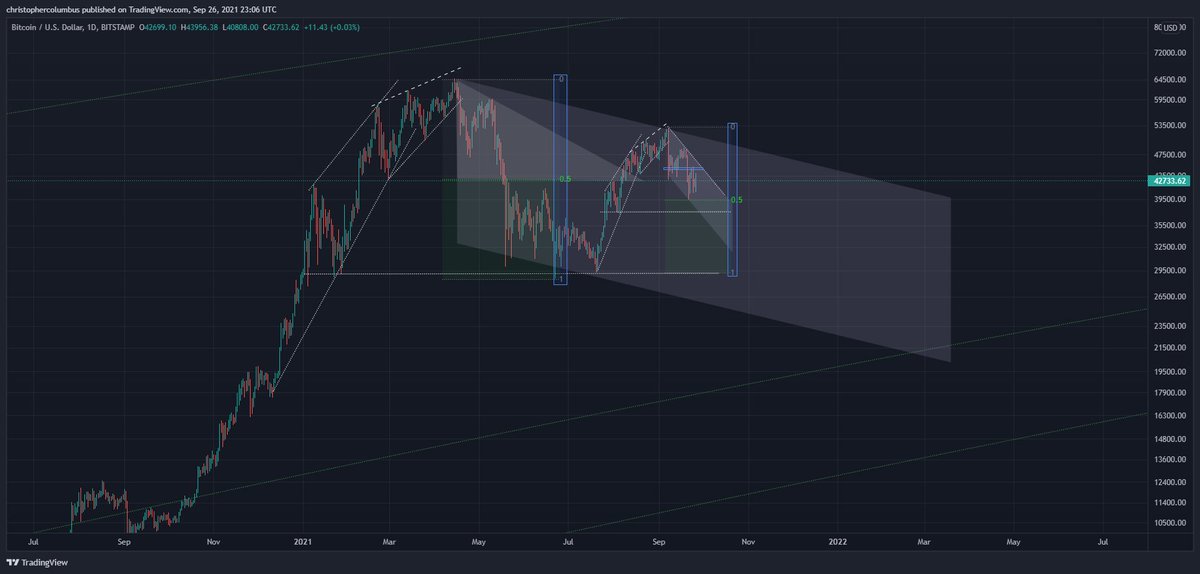
Given that the upward channel now looks broken to the downside, the chart explores a possible scenario going forward.
Nov 24, 2021 7 tweets 2 min read
Gives another meaning to 'blow-off top'.😎
Nov 23, 2021 4 tweets 2 min read
Experimental TA incoming.

Has anyone drawn an ascending triangle yet?

Heavy white dotted lines - connects previous base to the next base and through to the top.Experimental TA incoming. 
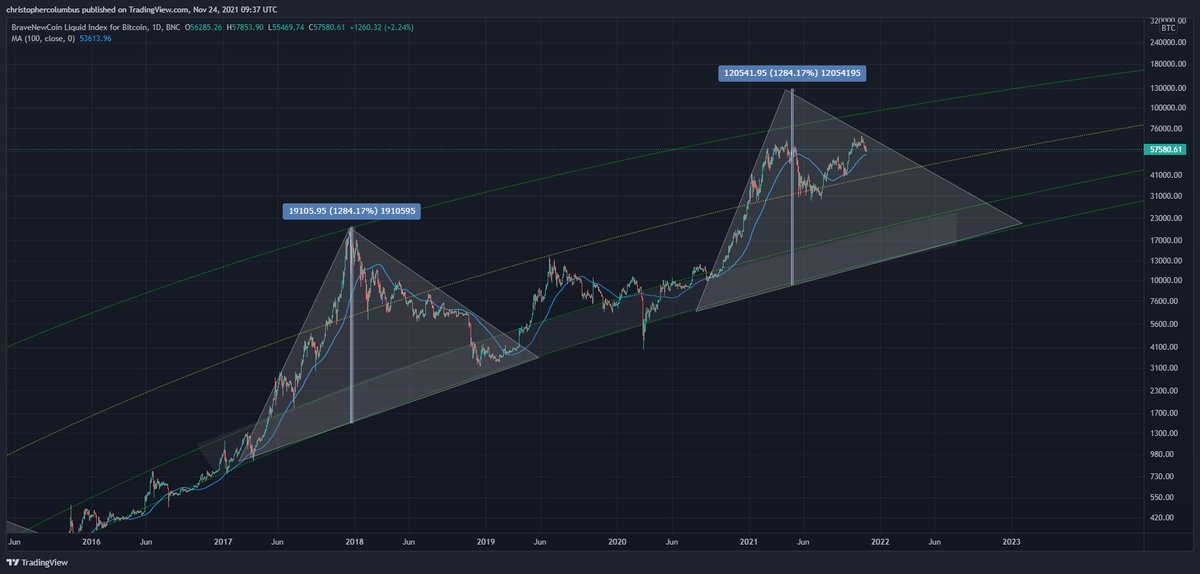
In this metric, there is room for a higher high [eventually] within the price range as configured.

Nov 22, 2021 6 tweets 2 min read
Objectively, a positive picture, and yet many would view it in utterly negative terms.... due no doubt to buying high. Image It's simple mean of prices that gives a regression curve around which price oscillates.

What's interesting is a changing dynamic [that denotes a maturing market imo] - price has stayed above this mean for quite some time.
Nov 21, 2021 4 tweets 1 min read
Reminder: BTC is in a secular bull market. Don't confuse realism with bearism.🙂 Perceptions are relative. When you're used to seeing hyper-bull posts, realism will *appear* bearish. The reality though is realism is bullish... even with consolidation.
Nov 19, 2021 5 tweets 1 min read
The dynamic of this market is starting to now look qualitatively different. What was before an idea [due to increased liquidity and a maturing market] is beginning to be confirmed in the price action. All good. The point of this post is that, from the macro perspective, even if we were to see an extended consolidation from here this need not be though of as a 'bear market'. That kind of outlook [fear] belongs to a more immature phase of the market along with talk of mulit-year cycles.
Oct 16, 2021 5 tweets 2 min read
Big picture stuff.

Even if price carried on up in the channel at this rate, it would not hit 100K by December. I'll always answer the odd question or comment that I think might be genuine. Other posts that are obviously boorish or trollish, I'll be blocking for a few months.
Oct 13, 2021 5 tweets 1 min read
A few more weeks, and you'll have the longest correction within what most term as a cyclical/ bull run up. Portending a double-top? 
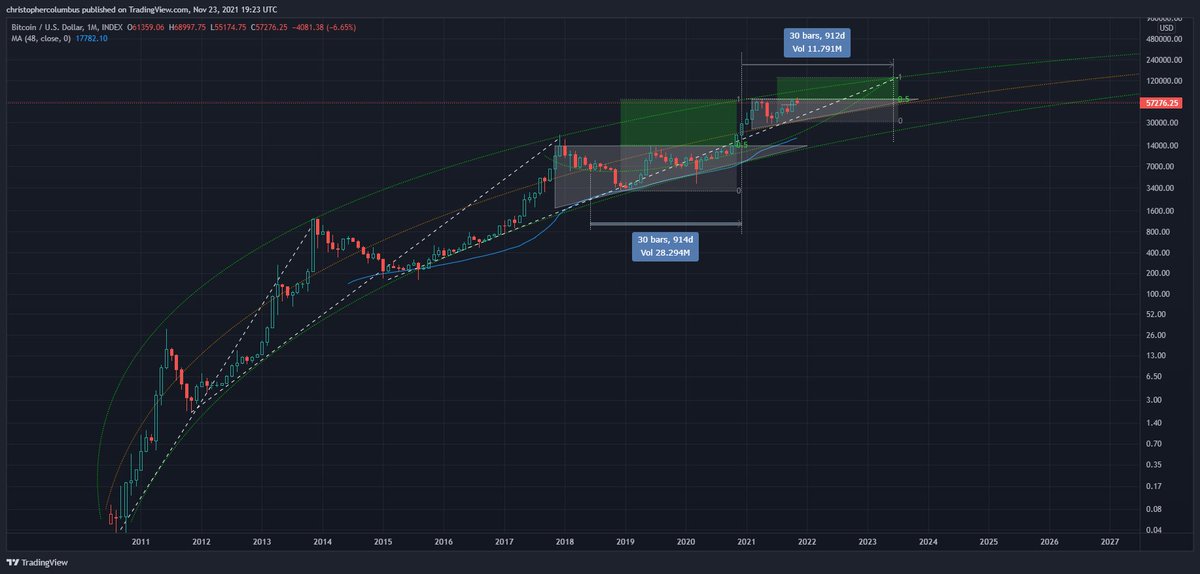
This would also work in with the absence of a blow-off top that confounded so many. This kind of new price action may reflect an increasingly liquid and maturing market...
Oct 11, 2021 10 tweets 2 min read
On the basis of TA, you can not become a stubborn bull or a bear in the shorter term if that TA also has invalidation levels baked into it. If it's invalidated, it's invalidated, time to move on. Those that either harp on about it being invalidated on the one hand, or cling on to their [short term] bull or bear mindset on the other are all TA illiterates.🙂
Oct 2, 2021 5 tweets 2 min read
Good to see some starting to get it. In an increasingly mature/ increasingly liquid market, nice neat multi-year cycles are dinosaurs. A 'lengthened' cycle also makes no sense in this scenario. Indeed, why talk of 'cycles' anymore [in referring to price development]?
Oct 1, 2021 5 tweets 2 min read
Monthly MACD monster well and truly crossed now. It looks scary, but the MACD is lower than previous, and continues down once the bottom is in. A possible scenario with price bottoming at the end of the quarter. This chart should show it increasingly unlikely that the current price action is comparable to 2013.
Sep 28, 2021 4 tweets 1 min read
Choose a method, all of which are different. But what they have in common is a criteria by which they could be invalidated. This is what makes them respectable.... their readiness to be wrong. And then you have the - 'it could go up or down'. No matter how respectable it sounds, without this criteria of invalidation, without a solid prediction, you just have pseudo-scientific nonsense.
Sep 26, 2021 4 tweets 1 min read
With the fractal largely having played out, time to move on. New short term chart, i.e.; more speculative than the longer-term charts. Image 
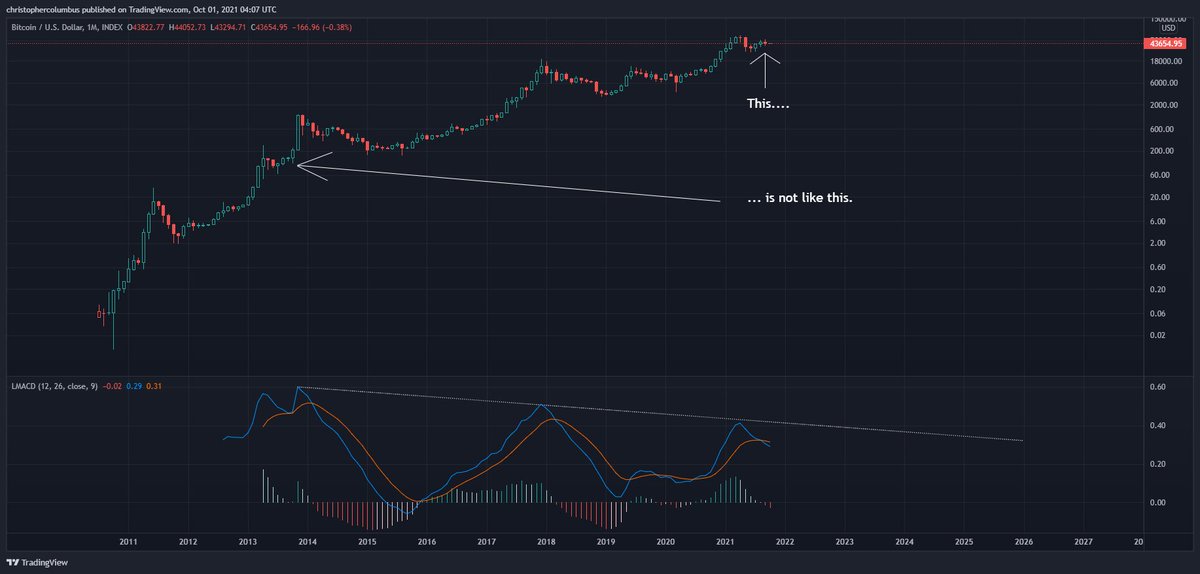
Previous short term thread/ fractal -

Nov 23, 2019 8 tweets 3 min read
New thread now that 6.7K was hit. In the buy zone where people should be averaging in imo. Will it go lower than 6.7K? May well do, but I wouldn't be betting on it. Next few posts will look at the various elements of support I'm seeing

Previous thread:
1/ Probably the simplest and most straightforward one - long term moving averages.

Price comes down hard finding support at the 4 year moving average [48 MMA], bounces and then finds support at the 3 year MA [36 MMA].
Nov 8, 2019 18 tweets 7 min read
New thread on correcting channel [No. 3]

Looking for grind down over the course of this last quarter. End of the correction in sight. Ideal buy target still 6.7K. Practical buy target the buy zone [shaded area].

Previous threads


Some trigonometry...

1] Medium term downward channel intact
2] Meeting the longer term mean of the cyclical curve [green dotted line]
3] meeting the longer term buy zone/ log growth curve

Fibs

1] An 'ideal' 50% retracement still on the cards
2] Time-wise nearing completion
Sep 28, 2019 52 tweets 13 min read
Time for a new thread now that the triangle's broken. Emphasis now shifting to bullish. Link to previous extended thread here


IDEAL, buying price 6.7K
Expect the 200 MDA to roll over then merge with the upward trending cyclical curve [green dotted line] I can see I might have to develop some vocabulary to avoid confusion between time frames. How about colors?

Red - Stop don't buy
Orange - cautious zone, look for better entry points
Green - Full on bull

No prizes for guessing which zone we be in.😎