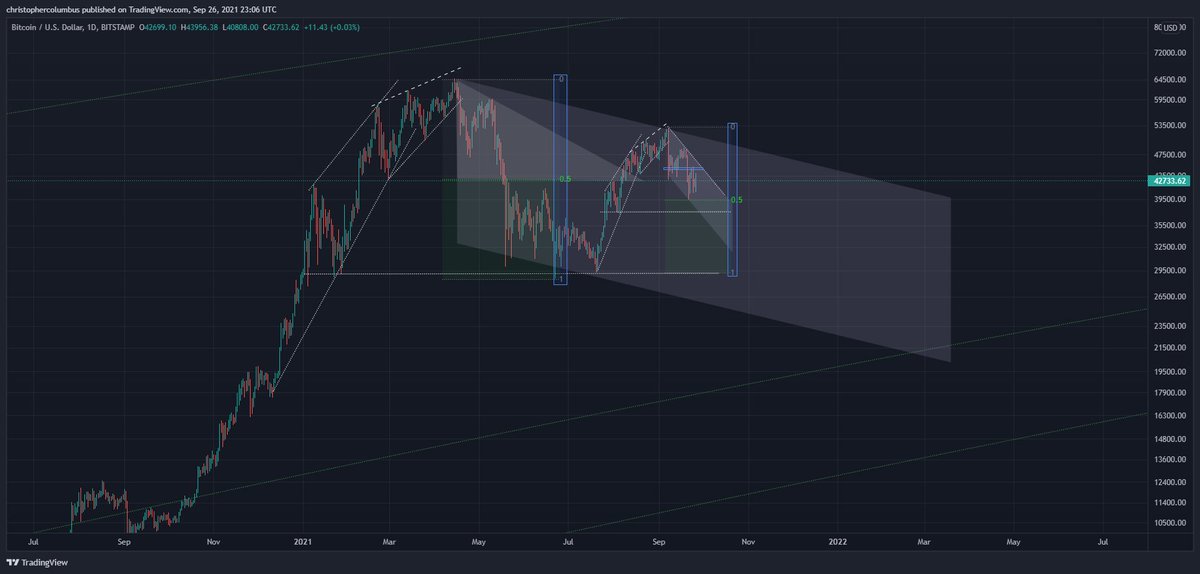
Choose a method, all of which are different. But what they have in common is a criteria by which they could be invalidated. This is what makes them respectable.... their readiness to be wrong.
And then you have the - 'it could go up or down'. No matter how respectable it sounds, without this criteria of invalidation, without a solid prediction, you just have pseudo-scientific nonsense.
Run a mile from anyone who dances around or dodges this [criteria of invalidation], for their fear of being wrong only goes to show they don't understand the nature of TA, modeling, and theory... they don't even have a proper theory.
The fear is that they themselves will be wrong as opposed to their theory... which they don't have.

• • •

Missing some Tweet in this thread? You can try to force a refresh
 

Keep Current with dave the wave🌊

dave the wave🌊 Profile picture

Stay in touch and get notified when new unrolls are available from this author!

Read all threads

This Thread may be Removed Anytime!

PDF

Twitter may remove this content at anytime! Save it as PDF for later use!

Try unrolling a thread yourself!

how to unroll video
  1. Follow @ThreadReaderApp to mention us!

  2. From a Twitter thread mention us with a keyword "unroll"
@threadreaderapp unroll

Practice here first or read more on our help page!

More from @davthewave

26 Sep
With the fractal largely having played out, time to move on. New short term chart, i.e.; more speculative than the longer-term charts. Image
'More speculative on the short-term' means half expect it to be wrong. Why chart it then? It maps out a *real* possibility. Consider it a stress- test, and risk management TA.
Read 4 tweets
23 Nov 19
New thread now that 6.7K was hit. In the buy zone where people should be averaging in imo. Will it go lower than 6.7K? May well do, but I wouldn't be betting on it. Next few posts will look at the various elements of support I'm seeing

Previous thread:
1/ Probably the simplest and most straightforward one - long term moving averages.

Price comes down hard finding support at the 4 year moving average [48 MMA], bounces and then finds support at the 3 year MA [36 MMA].
2/ The momentum indicator of the weekly Gaussian channel is interesting - turned green, moving up, and looking bullish. Much of my TA is momentum based, which I see as having both leading and lagging indicators to it - useful if it works.
Read 8 tweets
8 Nov 19
New thread on correcting channel [No. 3]

Looking for grind down over the course of this last quarter. End of the correction in sight. Ideal buy target still 6.7K. Practical buy target the buy zone [shaded area].

Previous threads


Some trigonometry...

1] Medium term downward channel intact
2] Meeting the longer term mean of the cyclical curve [green dotted line]
3] meeting the longer term buy zone/ log growth curve

Fibs

1] An 'ideal' 50% retracement still on the cards
2] Time-wise nearing completion
This could be it. The last move down, and then off to the races. Dry powder left? Buy in the buy zone [grey shaded area].
Read 18 tweets
28 Sep 19
Time for a new thread now that the triangle's broken. Emphasis now shifting to bullish. Link to previous extended thread here


IDEAL, buying price 6.7K
Expect the 200 MDA to roll over then merge with the upward trending cyclical curve [green dotted line]
I can see I might have to develop some vocabulary to avoid confusion between time frames. How about colors?

Red - Stop don't buy
Orange - cautious zone, look for better entry points
Green - Full on bull

No prizes for guessing which zone we be in.😎
Just to clarify.

As I'm not a day-trader, I consider the short/ immediate term can go either way/is random. From my perspective short term volatility is relatively unpredictable, and so I focus on the medium and the long term.

It's in this medium term that I am turning bullish
Read 52 tweets
11 Jul 19
If the correction is as long as the parabolic rise, looking at the end of the year.
Short term prediction on the basis of a comparison between the parabolas.

Bounce to 10K then down to7K range.
Takeaways for the hodler/ investor:

- the moving averages have bottomed earlier, and should never go as low
- 100 MDA should re-cross the 200MDA
- price briefly through the 200 MDA, then acts as support
- solid support with the 200 WMA.
- DCA if no core position
Read 79 tweets
6 Jul 19
Say BTC were to reach 100K in the next few years.

Currently has reached over 30% [yes, you read that right] but only in 10% of the time.

In this scenario, a decent correction would make a lot of sense.
11K is, believe it or not, a third of the way from 3.2 to 100K

They used to say, of the old banking system, when it paid interest, that the most important thing to grasp was 'the power of compounding interest'. Well, today it's all about exponential increase on the log scale
It's the essence of 'money illusion' to focus on the actual number [nominalism] instead of the real values that lie behind the numbers. It's like saying time is hours and minutes... when hours and minutes are actually just what measures time. A bit of a rabbit hole...
Read 5 tweets

Did Thread Reader help you today?

Support us! We are indie developers!


This site is made by just two indie developers on a laptop doing marketing, support and development! Read more about the story.

Become a Premium Member ($3/month or $30/year) and get exclusive features!

Become Premium

Too expensive? Make a small donation by buying us coffee ($5) or help with server cost ($10)

Donate via Paypal Become our Patreon

Thank you for your support!

Follow Us on Twitter!

:(