
Scotland, PHS Weekly COVID report
Others cover this report so we don’t post much on it, but it is a really interesting resource, and thanks to PHS for bringing it together.
Wanted to put a few observations out there taken up to and including the latest report.
Others cover this report so we don’t post much on it, but it is a really interesting resource, and thanks to PHS for bringing it together.
Wanted to put a few observations out there taken up to and including the latest report.
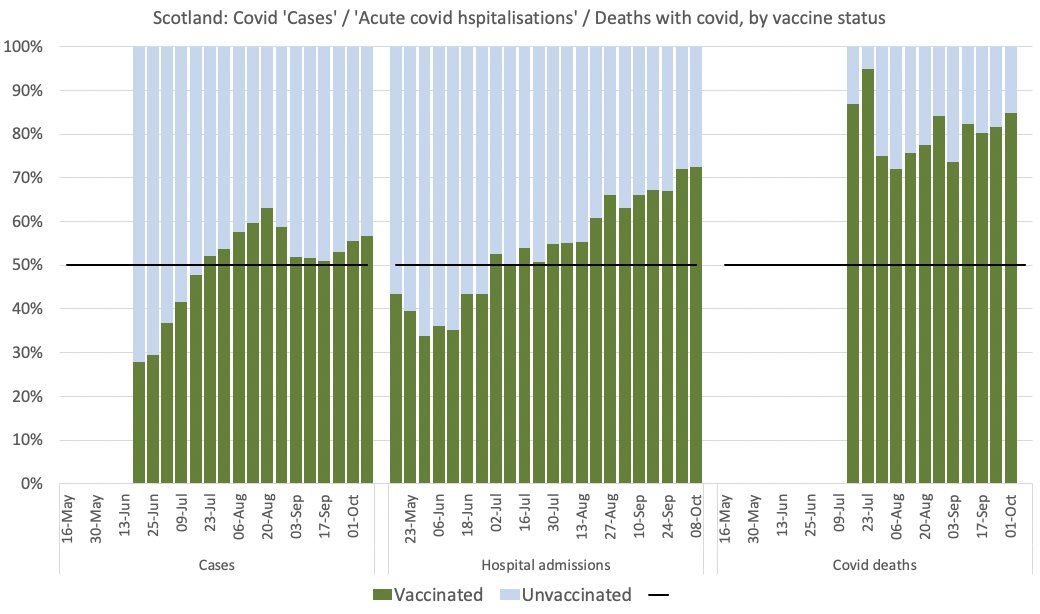
1/ Overall trend
‘Cases’ are heavily skewed by who is tested, but even so cases are now >50% in vaccinated population.
‘Acute covid hospital admissions’ also now >70% vaccinated, and trend *very* clear.
‘Deaths with covid’ remains >80% fully vaccinated
‘Cases’ are heavily skewed by who is tested, but even so cases are now >50% in vaccinated population.
‘Acute covid hospital admissions’ also now >70% vaccinated, and trend *very* clear.
‘Deaths with covid’ remains >80% fully vaccinated
2/ Acute covid hospitalisation
This is key, as the main focus of the vaccine.
Below summarised the *fully* vaccinated and unvaccinated populations, and the hospital admissions from each.
Unvaccinated risk is 1 in 406, and fully vaccinated is 1 in 607.
This is key, as the main focus of the vaccine.
Below summarised the *fully* vaccinated and unvaccinated populations, and the hospital admissions from each.
Unvaccinated risk is 1 in 406, and fully vaccinated is 1 in 607.

That’s a 33% reduction - so not the 95%, but not insignificant. The trouble is we have far MORE hospital admissions. Success?
We can also then model - what if everyone were vaccinated, 100%?
The unvaccinated admissions may reduce 33% - looks like this.
Rather a small reduction.
We can also then model - what if everyone were vaccinated, 100%?
The unvaccinated admissions may reduce 33% - looks like this.
Rather a small reduction.


So what’s the impact, can we ‘Save the NHS’?
It looks like this. The yellow is current ‘covid admissions’, the black line is how it might be.
The blue is all other admissions, and the green is the capacity we do not/cannot use now
Covid admissions barely change, & far above 2020.
It looks like this. The yellow is current ‘covid admissions’, the black line is how it might be.
The blue is all other admissions, and the green is the capacity we do not/cannot use now
Covid admissions barely change, & far above 2020.

The other is covid deaths. PHS used to publish by age and vaccine status, but stopped that, now showing ‘Age Standardised Mortality Rate’ (ASMR) instead.
ASMR averages 6.97 for unvaccinated, rises for 1 dose, then down to 1.91 for fully vaccinated.
ASMR averages 6.97 for unvaccinated, rises for 1 dose, then down to 1.91 for fully vaccinated.

However,
(1) Why only ‘covid deaths’ - surely ‘all-cause mortality’ must be the focus? No point reducing covid and increasing other deaths?
(2) That 6.97 is per 100,000. In percentage terms that is 0.00697%. Yes, the risk of covid is 0.00697%, reduced to 0.00191%.
(1) Why only ‘covid deaths’ - surely ‘all-cause mortality’ must be the focus? No point reducing covid and increasing other deaths?
(2) That 6.97 is per 100,000. In percentage terms that is 0.00697%. Yes, the risk of covid is 0.00697%, reduced to 0.00191%.

To put in context, latest Scotland ASMR was 1,184, which was 1.184% chance of death from ALL causes.
Fully vaccinated - & assuming no adverse events at all - that risk becomes 1.179%.
Year by year natural variation in ASMR is hugely more than this reduction.
So much pain, for..?
Fully vaccinated - & assuming no adverse events at all - that risk becomes 1.179%.
Year by year natural variation in ASMR is hugely more than this reduction.
So much pain, for..?

• • •
Missing some Tweet in this thread? You can try to
force a refresh


