
Here comes the 3rd and final part of the long weekend 'Beginners' Pathway" series.
In this we'll see Open Interest basics and Option Chain Analysis.
In this we'll see Open Interest basics and Option Chain Analysis.
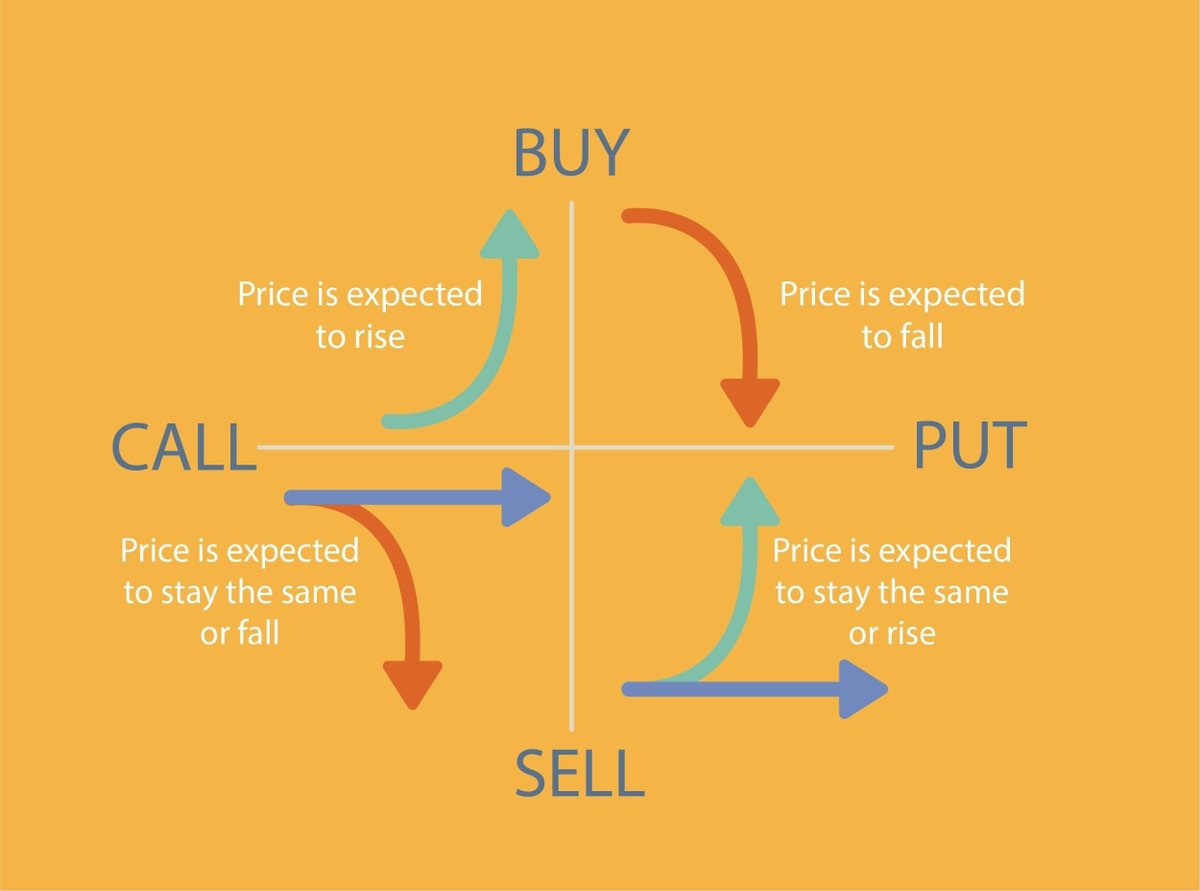
There are two types of Options, Call Option & Put Option. 
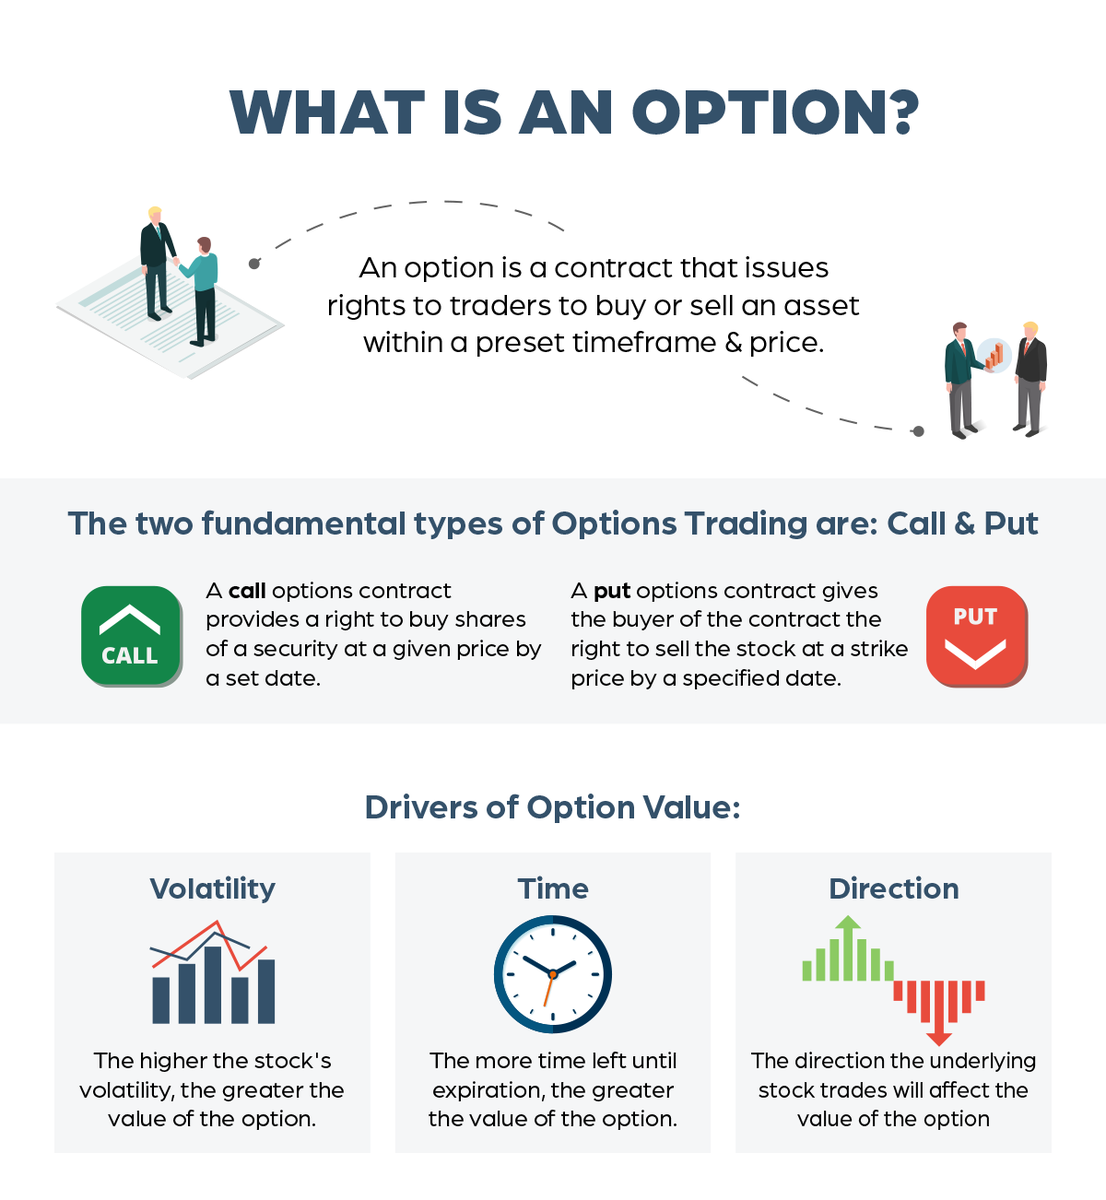
This graphics show when to buy and when to sell options.
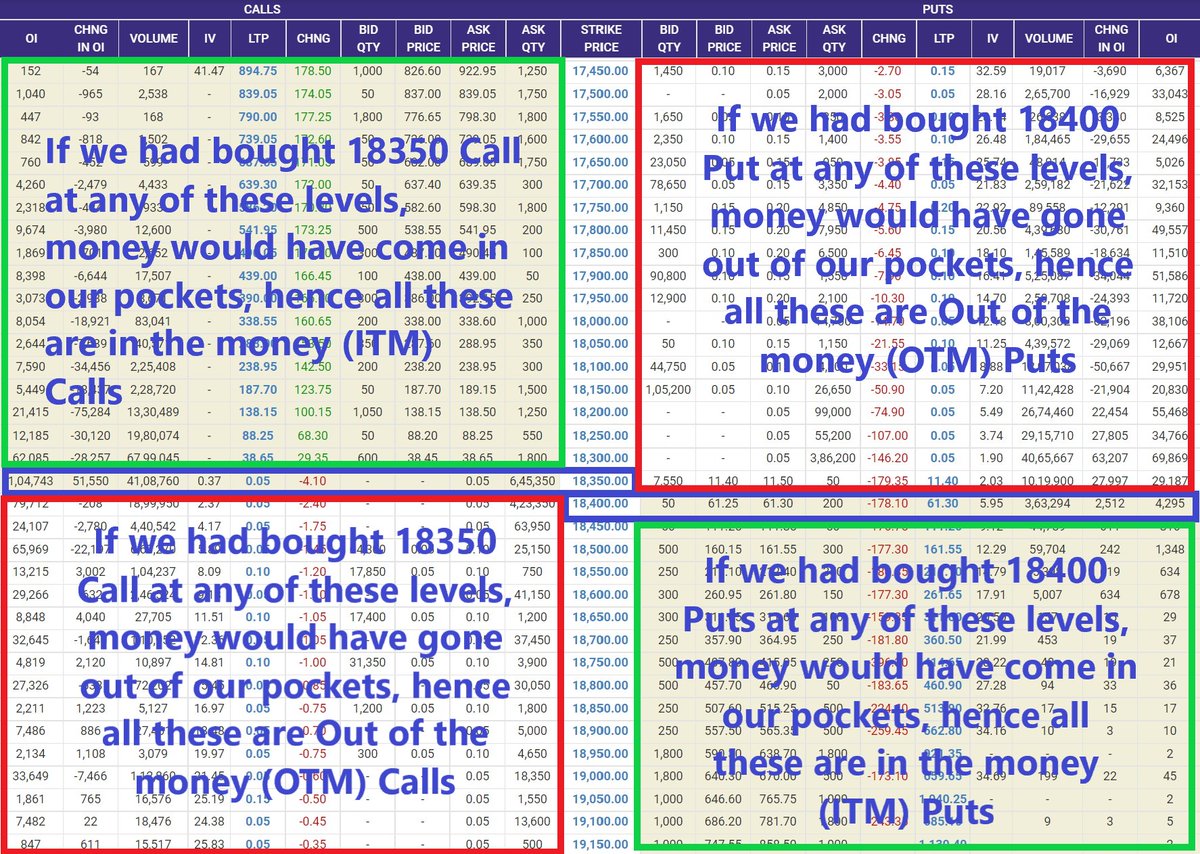
The first thing that we need to know is the moneyness i.e. whether an Option is At the money (ATM), In the money (ITM) or Out of the Money (OTM).
The strike closest to the market price is At The Money.
I have tried to explain OTM & ITM in a very simplistic & easy manner.
The strike closest to the market price is At The Money.
I have tried to explain OTM & ITM in a very simplistic & easy manner.
Lets see each item one by one

OI (Open Interest) – is the number of open contracts relating to that strike. One buy & sell transaction constitutes one unit of OI.
CHNG IN OI – is the change in OI as compared to last day
VOLUME – is the total number of contracts that are traded for a specific strike.
CHNG IN OI – is the change in OI as compared to last day
VOLUME – is the total number of contracts that are traded for a specific strike.
IV means Implied Volatility, High IV means market is expecting more fluctuations in future.
LTP means the Last Traded Price or Premium of an option.
LTP means the Last Traded Price or Premium of an option.
CHNG shows net change in LTP. It is shown in green if prices have risen and in red if prices have fallen.
BID QTY Shows the current demand for the order.
BID PRICE – If this is higher than LTP then it indicates higher demand for the option and vice versa.
BID QTY Shows the current demand for the order.
BID PRICE – If this is higher than LTP then it indicates higher demand for the option and vice versa.
ASK PRICE – Price at which latest sell order got placed.
ASK QTY – is the number of orders that are open. It shows the supply at a particular strike.
ASK QTY – is the number of orders that are open. It shows the supply at a particular strike.
With these basics of Option Chain, I'll come to a simpler version of it which is supplied by Zerodha to its users:
web.sensibull.com/option-chain?e…
It has cut out some info like Bid/Ask etc making it more useful.
web.sensibull.com/option-chain?e…
It has cut out some info like Bid/Ask etc making it more useful.
Now the most important part how do we analyse the option chain.
Max OI - First see at what strikes is the max OI buildup
Delta OI - Then see how the OI buildup is changing, in Zerodha option chain you can see OI change in % and with a bar chart which makes it easier to observe.
Max OI - First see at what strikes is the max OI buildup
Delta OI - Then see how the OI buildup is changing, in Zerodha option chain you can see OI change in % and with a bar chart which makes it easier to observe.
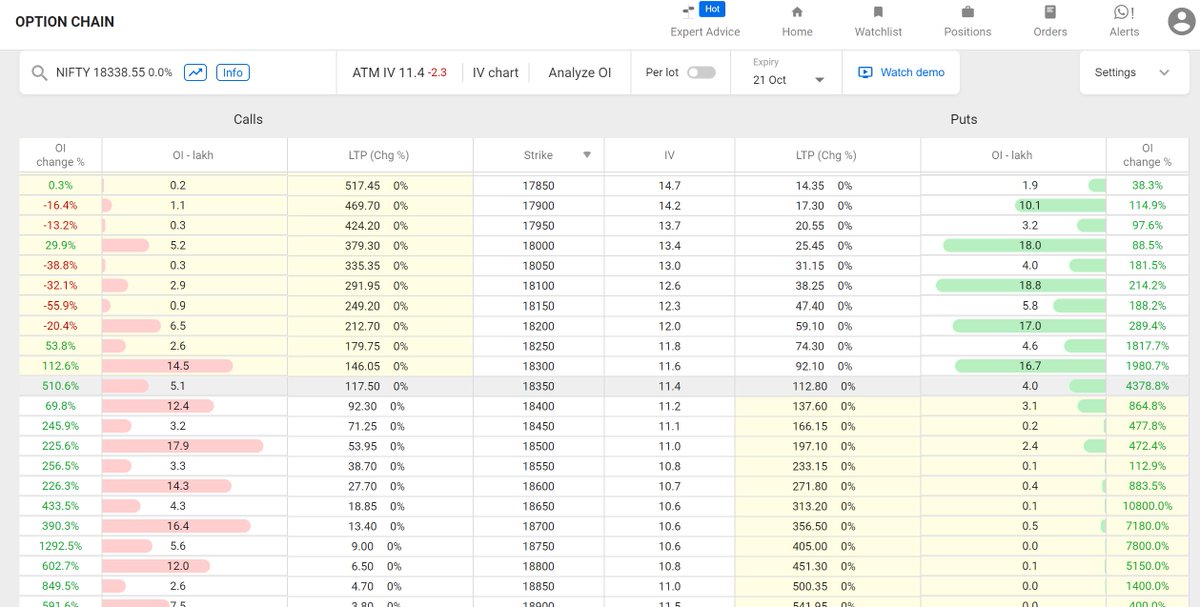
Delta OI Velocity - Observe how fast OI is changing at these top 3 strikes. Again Zerodha option chain makes the visualization easier.
Delta OI Displacement - See where is this changed Oi moving. Is it moving from Calls to puts or vice versa, if yes, to what strikes.
Delta OI Displacement - See where is this changed Oi moving. Is it moving from Calls to puts or vice versa, if yes, to what strikes.
OI analysis is always done from the point of view of the Option Writers i.e. option sellers and not from the perspective of option buyers.
OI addition at Calls means strong resistance at these levels.
If addition is at puts it means strong support is forming.
OI addition at Calls means strong resistance at these levels.
If addition is at puts it means strong support is forming.
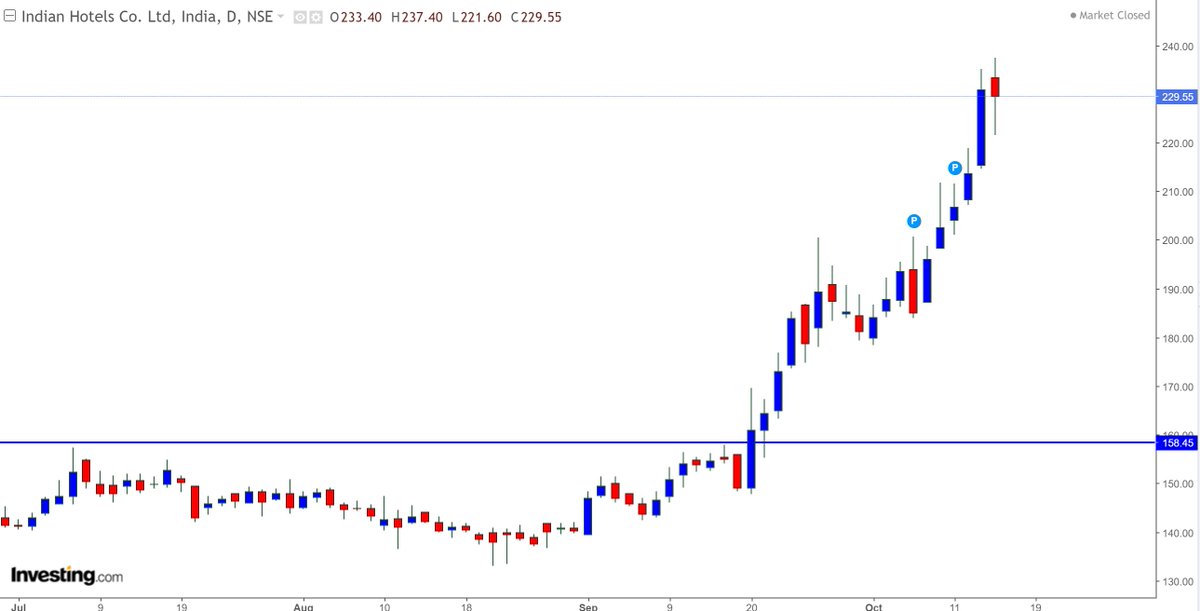
Recently there was OI addition at calls in Indian Hotels and price was at resistance level.
Inference from this observation was that Stock is likely to face resistance at these levels and if this level is breached, run up would be fast as call writers would run for cover.
Inference from this observation was that Stock is likely to face resistance at these levels and if this level is breached, run up would be fast as call writers would run for cover.

You may all see what happened in Indian Hotels counter after this resistance level where Call OI buildup was huge, was broken on upside.
For Nifty and BankNifty OI observation, there is a very good site tradingtick.com by @tradingtick
For BankNifty there is this Telegram channel by @TRADERSloopIN telegram.me/joinchat/ofXg3… This has excellent OI info relating to BankNifty.
For BankNifty there is this Telegram channel by @TRADERSloopIN telegram.me/joinchat/ofXg3… This has excellent OI info relating to BankNifty.
You may see trending OIs here tradingtick.com/options/trendi…
Call Vs Put OI can be seen from various angles at this site.
Since its visual, it helps in quick analysis.
Any Crossover in Call vs. Put OIs is a definitive sign of direction change.
Since its visual, it helps in quick analysis.
Any Crossover in Call vs. Put OIs is a definitive sign of direction change.

This is another feature that can show you Delta OI & Delta OI displacement in visual form.

There are few questions and misconception about Open Interest, that I come across regularly.
Like:
Why is OI anlysed from the point of view of Sellers.
When there is always 1 buy and 1 sell transaction in one unit of OI then how does it impact anything ?
lets take 1 by 1
Like:
Why is OI anlysed from the point of view of Sellers.
When there is always 1 buy and 1 sell transaction in one unit of OI then how does it impact anything ?
lets take 1 by 1
OI is always analysed from Option Sellers' perspective because Sellers are the dominant force. Buyers are minnows and Sellers are whales. It takes large capital and big conviction to sell options, that's why they drive the market and that's why we analyse OI from their POV.
In his principal work, Traité d'économie politique, the liberal French economist Jean-Baptiste Say wrote that 'supply creates its own demand'. Hence, when there is a seller a buyer will emerge from somewhere.
OI market is all supply driven, and retail can't supply to wholesale.
OI market is all supply driven, and retail can't supply to wholesale.
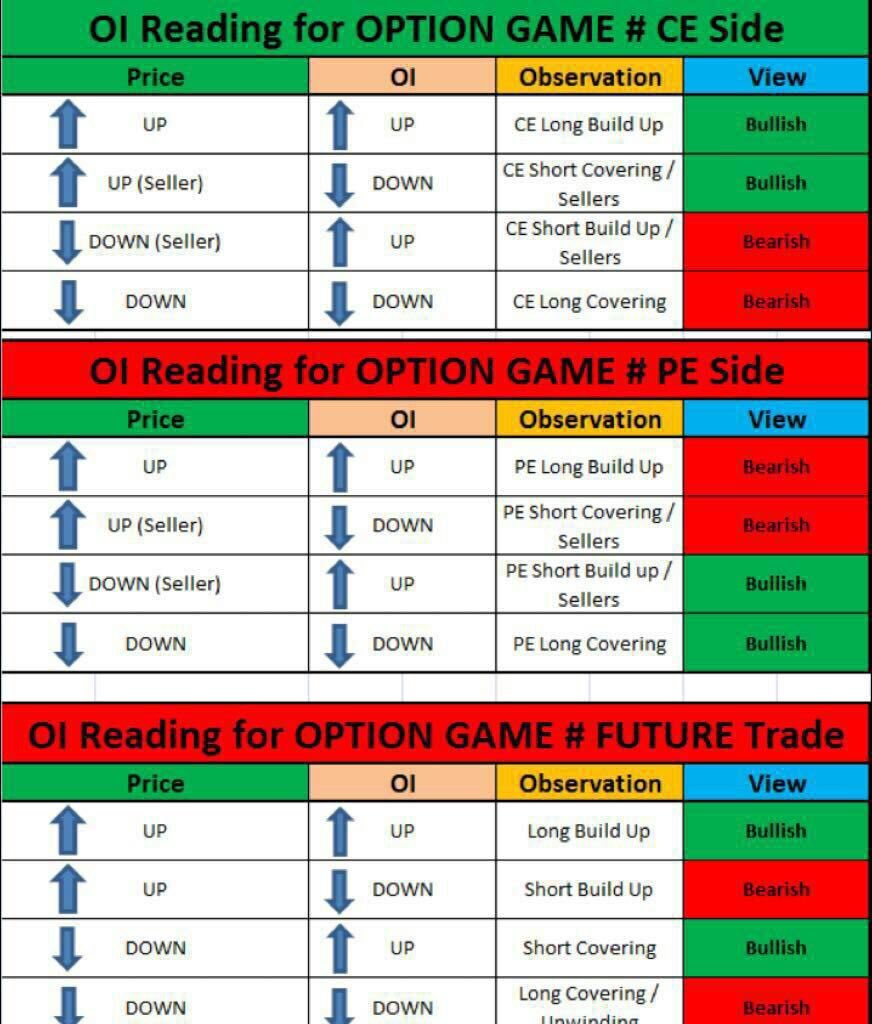
Here is a good infographic that shows how OI is to be read.
Here is a document on OI by the maestro himself.

Specific Inferences:
If nearest OTM CEs have the highest open interest and more addition is taking place, then the price is not likely to break that level.
If OI in ATM and nearest ITM puts is decreasing it means price is likely to fall and breach that level.
If nearest OTM CEs have the highest open interest and more addition is taking place, then the price is not likely to break that level.
If OI in ATM and nearest ITM puts is decreasing it means price is likely to fall and breach that level.
If nearest OTM Calls are showing reduction in OI then price is likely to cross that levels.
Addition of OI in ATM and ITM Puts shows that price is likely to remain strong and not come down.
Addition of OI in ATM and ITM Puts shows that price is likely to remain strong and not come down.
How to find Support & Resistance using OI or how to correlate Support & Resistance as per Price Action with OI analysis.

Here is a little about Options Greeks also

I conclude this OI Analysis thread with this video on how to download Live Option Chain Data in Excel and analyse it on your own.
After that data is downloaded you may use following process to analyse the data
analyticsvidhya.com/blog/2021/03/s…
After that data is downloaded you may use following process to analyse the data
analyticsvidhya.com/blog/2021/03/s…
Missed posting the video link. Its here
• • •
Missing some Tweet in this thread? You can try to
force a refresh


