I did appreciate the conversation, but it’s telling that one of the main data points @drsanjaygupta , chief medical correspondent @CNN ,chose to educate @joerogan on probably isn’t correct.
Here’s the citation/claim about COVID myocarditis cdc.gov/mmwr/volumes/7…
Here’s the citation/claim about COVID myocarditis cdc.gov/mmwr/volumes/7…
https://twitter.com/Neoavatara/status/1449194635335700484

Pretty simple math : (myocarditis diagnosed / ppl with Covid) was found to be 16x higher than (myocarditis diagnosed / ppl without COVID)
But did the study get the denominator of people who had COVID right?
But did the study get the denominator of people who had COVID right?
Ppl with COVID was based on those who received a diagnosis of COVID-19 in an encounter w/ the health system.
That mild cold the 5 year old had that u didn’t call anyone about?
Not included in the denominator per this CDC reported.
That mild cold the 5 year old had that u didn’t call anyone about?
Not included in the denominator per this CDC reported.
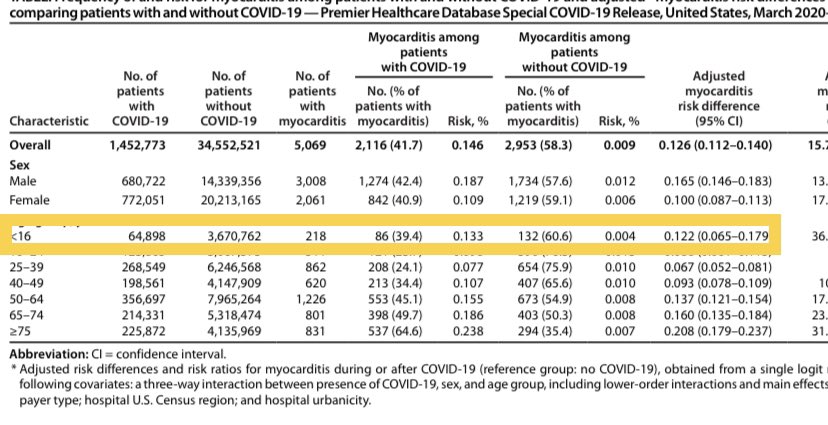
The row of interest in this CDC table is the <16 cohort and is what @drsanjaygupta is quoting. 86 myocarditis cases are identified in those diagnosed with COVID (64,898). This predicts 1/754 kids will have myocarditis if they get COVID. 

But that denominator — 64,898 — is clearly an undercount because if only includes symptomatic people who had a positive COVID test.
We can estimate how far off they may be by using seroprevalence data from the @CDCgov
We can estimate how far off they may be by using seroprevalence data from the @CDCgov
Testing for antibodies in a population sample is generally accepted (unless its done in Santa Clara in Spring 2020) as a way of gauging prevalence of disease in a population. That’s what the CDC did in Missisippi with COVID. cdc.gov/mmwr/volumes/7… 

This CDC study estimated a ~10% prevalence (with a wide range based on ethnicity) in ppl < 18yo in Mississippi between May - Sep 2020.
Keep in mind the Cdc paper we’re analyzing covers Mar-Jan 2021 (6 more months)
Keep in mind the Cdc paper we’re analyzing covers Mar-Jan 2021 (6 more months)

If you assumed a minimum of 10% prevalence (an underestimate since the Cdc myocarditis report covers 2x more months than the Mississippi study) in this population of ~3.6million kids < 16 , that comes to ~360,000 who had COVID .. not 64,898.. 

The numerator would change 2 of course, but the 1:754 (86:64,898) estimate as it relates to risk of covid myocarditis wld seem to be a pretty sig. overestimate.
Interestingly, 1 way of checking these CDC #s wld be to see if the without COVID myocarditis rates are close to the prior baseline prevalence of myocarditis (132:3670762). They aren’t..the rate here ~4/100k, is much higher than xpected 0.25-2:100k/yr
researchgate.net/publication/32…
researchgate.net/publication/32…
There are other problems:
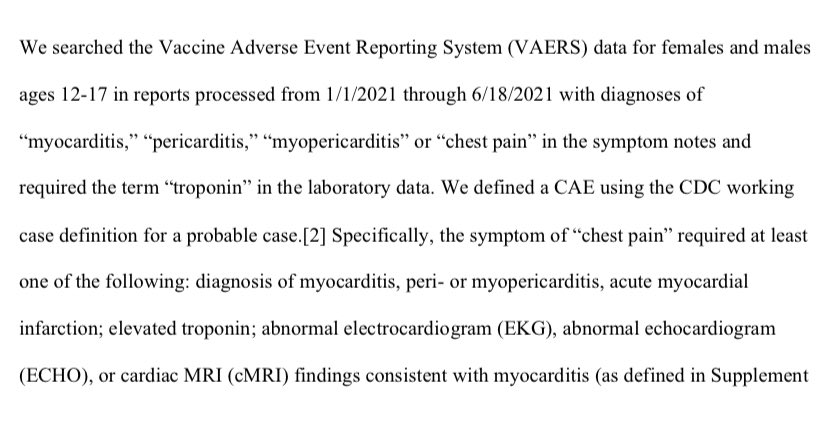
Myocarditis was determined by ICD10 code only and was not confirmed by clinical data (laboratory tests or cardiac imaging)
Myocarditis has many causes other than COVID… no chart review took place to exclude alternative possibilities
Myocarditis was determined by ICD10 code only and was not confirmed by clinical data (laboratory tests or cardiac imaging)
Myocarditis has many causes other than COVID… no chart review took place to exclude alternative possibilities
Also.. sick inpatients are understandably investigated/ probed with diagnostic tests (like troponins and imaging) at much higher rates than those not encountering the health system
So the rate of pulmonary nodules in patients admitted to the hospital with a pneumonia are sure to be much higher than a control population not encountering the health system.
This does not mean pneumonias cause pulmonary nodules
This does not mean pneumonias cause pulmonary nodules
It does mean that every novel virus that results in a Bolus of sick patients in hospitals will be found to have higher rates of myocarditis, especially if the only thing used to identify cases are ICD 10 codes.
Look what happens in an EMR study where they require an ICD diagnosis of myocarditis AND supportive laboratory / imaging data.
Notice myocarditis case spikes above the prepandemic baseline happens in the post vaccine era, not during COVID..
jamanetwork.com/journals/jama/…

Notice myocarditis case spikes above the prepandemic baseline happens in the post vaccine era, not during COVID..
jamanetwork.com/journals/jama/…


@joerogan referred to a preprint that suggested an elevated myocarditis risk in young boys (in line with a later @NEJM study) in the US to ? how necessary vaccines were for that group.
tinyurl.com/4jnchwp3
tinyurl.com/9ykh7m
tinyurl.com/4jnchwp3
tinyurl.com/9ykh7m
Gupta’s counter to rogan that COVID is 16x more likely in the unvaxxed based on the CDC report we’ve been discussing isn’t unexpected, but brings the analytical chops of both the CDC and Gupta into ?.
Gupta either knows , but thinks the larger goal of max vaccination is 2 important, or he doesn’t have the ability to go beyond what the cdc proclaims..
Both are problematic, and make Rogan’s point about trust in the MSM and the public health community they parrot.
Both are problematic, and make Rogan’s point about trust in the MSM and the public health community they parrot.
If you can’t trust the Cdc/public health/MSM to communicate about issues related to vaccines in young boys, why trust their analysis on anything?
Here’s a visualization of just how deep the hole public health has dug itself..
Here’s a visualization of just how deep the hole public health has dug itself..
• • •
Missing some Tweet in this thread? You can try to
force a refresh


