If net zero is going to happen we need to re-do the industrial revolution all over again.
It’s hard to express how big a deal this is.
But I’ve had a go here: edmundconway.com/the-industrial…
The point is the Industrial Revolution wasn’t just about steel or textile manufacture.
It was a chemicals revolution
A concrete revolution
A glassmaking revolution
An aluminium revolution
A metals refining revolution
Plastics, silicon, fertilisers, batteries… I could go on…
And, guess what, ALL of those processes emit carbon. Sometimes via energy (OK so we can power them via renewables)
But also invariably carbon is emitted as part of the chemical/industrial process itself.
This chart from today’s HMT review of net zero underlines it.
CO2 EVERYWHERE
Those modelling net zero vaguely assume in the medium/long term we’ll be able to innovate our way out of these 👆emissions.
It might be possible.
But let’s not lose sight of how monumental a challenge (& perhaps an opportunity) that is.
Anyway. More here: edmundconway.com/the-industrial…
• • •
Missing some Tweet in this thread? You can try to
force a refresh
I really REALLY didn’t want to have to do another Covid thread. Really. But given the numbers are on the rise - along with the inevitable hot takes (we’re heading for disaster! The vaccines aren’t working!), I’m dipping my toe back in the waters. Hopefully not for long. 🧵
Let’s start with this chart. You’ve prob seen it elsewhere. This Scary Chart shows that the UK’s COVID situation looks UNIQUELY terrible. Just look at that red line compared with other countries!
But that chart 👆misses out the most important bit of context: for better or worse the UK is doing far more Covid testing than almost any other country (first chart here). Put those two datapoints together to see positive tests as a % of total and UK situation looks less dramatic
Here’s a thread abt a few of the most important things you need to know about getting to net zero and eliminating carbon emissions, but before we get stuck in let’s begin with a question.
How much do you suppose governments around the world are spending on research into energy?
If you’re anything like me you’re probably assuming they’re spending more than ever before. After all, they say they’re serious about averting climate change. They’ve pledged to eliminate emissions by 2050, right? And to do that we’re going to need serious tech breakthroughs…
This is an @IEA chart that underlines that need for tech breakthroughs. These bars show you how the world eliminates CO2 emissions by 2050. The key thing to focus on is the yellow bit.
Nearly HALF of all the emissions reductions are due to “technologies under development”
New: Kristalina Georgieva's position as IMF managing director is hanging in the balance. She's up before the IMF Executive Board today in what insiders fear could turn into a dismissal hearing. If so it would make her the shortest-lived IMF MD in fund history.
Georgieva's position has been in doubt since an internal investigation concluded she was involved in manipulation of data in a key World Bank report, Doing Business, which favoured China. She denies any wrongdoing. If other things weren't aligned against her perhaps she'd survive
IMF sources fear Georgieva has fallen out of favour with the White House, and given the US has the most votes at the Exec board that is a big problem for her. She may retain the backing of some EU states but most are waiting to see what the Biden admin decides
It’s all very well govt assuring us there’s no shortage of petrol supply, or that the crisis is abating.
I've no reason to doubt them.
But surely the simplest way to assure everyone would be to publish the last few weeks' data on fuel stocks and sales? news.sky.com/story/when-jus…
We know such data exists because up until v recently BEIS was publishing it - every week - as a COVID-related stat.
They stopped doing so v recently.
Based on the publication schedule we won’t get fresh data on this latest period for MONTHS.
This is not good enough.
There’s nothing stopping govt from publishing this data, save - I presume - for an inherent bias towards secrecy.
If they published it it could prove definitively that there was no shortage in forecourts before the panic buying.
So for heavens sake SHOW US THE DATA…
The energy crisis is complicated, almost certainly more complicated than you imagine. So be wary of seductive catch-all explanations: it’s Russia’s fault! It’s climate change policy’s fault! It’s all because the wind isn’t blowing! The reality is there’s a lot going on at once.🧵
A lot of people are convinced this is all because Russia has restricted flows of gas. And flows coming from the Yamal pipeline certainly dropped sharply in Aug. BUT actually Russian flows are UP vs start of 2021 (albeit lower than pre-pandemic). Good @WoodMackenzie chart:
A far bigger part of the explanation for rising gas prices is those two red arrows on the left of the chart. We’re not getting as much LNG tanker deliveries as usual and domestic gas fields aren’t producing as much as usual. These seem like bigger deals than Russian supply.
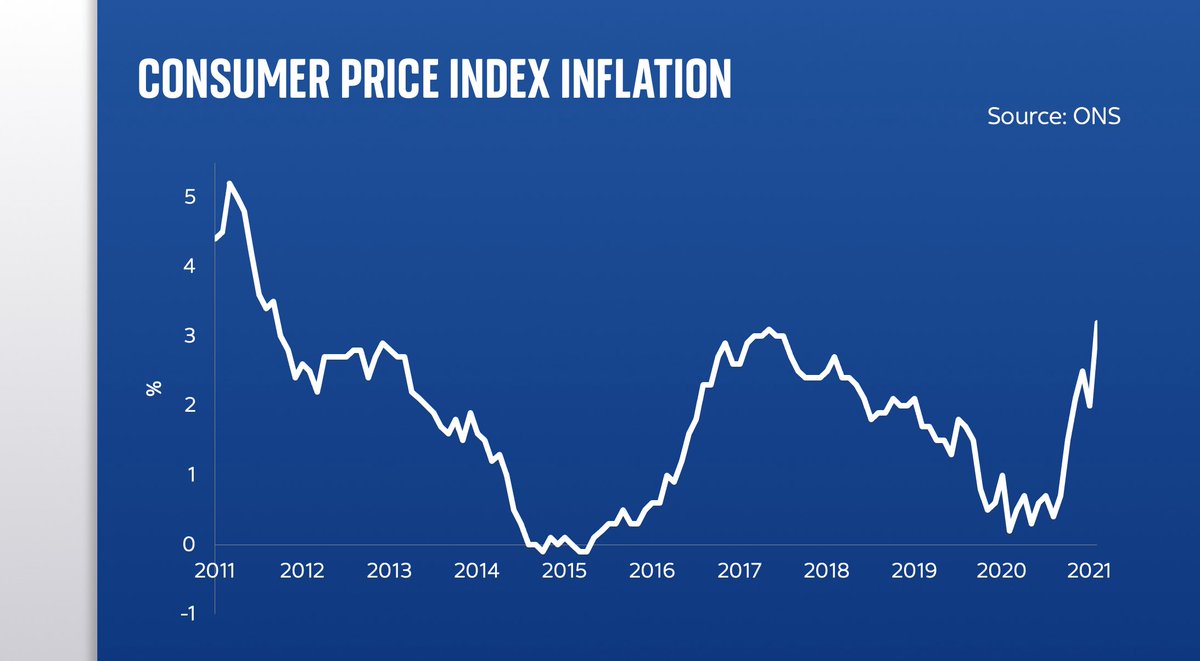
BIG jump in UK CPI inflation.
Up from annual rate of 2% in July to 3.2% in Aug.
Not just the highest level of inflation since 2012, it’s also the biggest month-on-month change in the level in the history of this inflation measure (going back to 1997)
Here’s one reason to believe the inflation rise may be temporary: the main contributing factor was a BIG jump in prices, this year vs last, in restaurants.
And what was happening last year? Eat Out to Help Out.
Once that washes out, some of the upward pressure should go away…
Here’s a reason to believe the rise in inflation may NOT be temporary. Lots of pricing pressure in the pipeline, inc THIS: energy prices are going up v v fast, which will feed into household bills in the coming months. And that’s before you consider costs of raw goods…