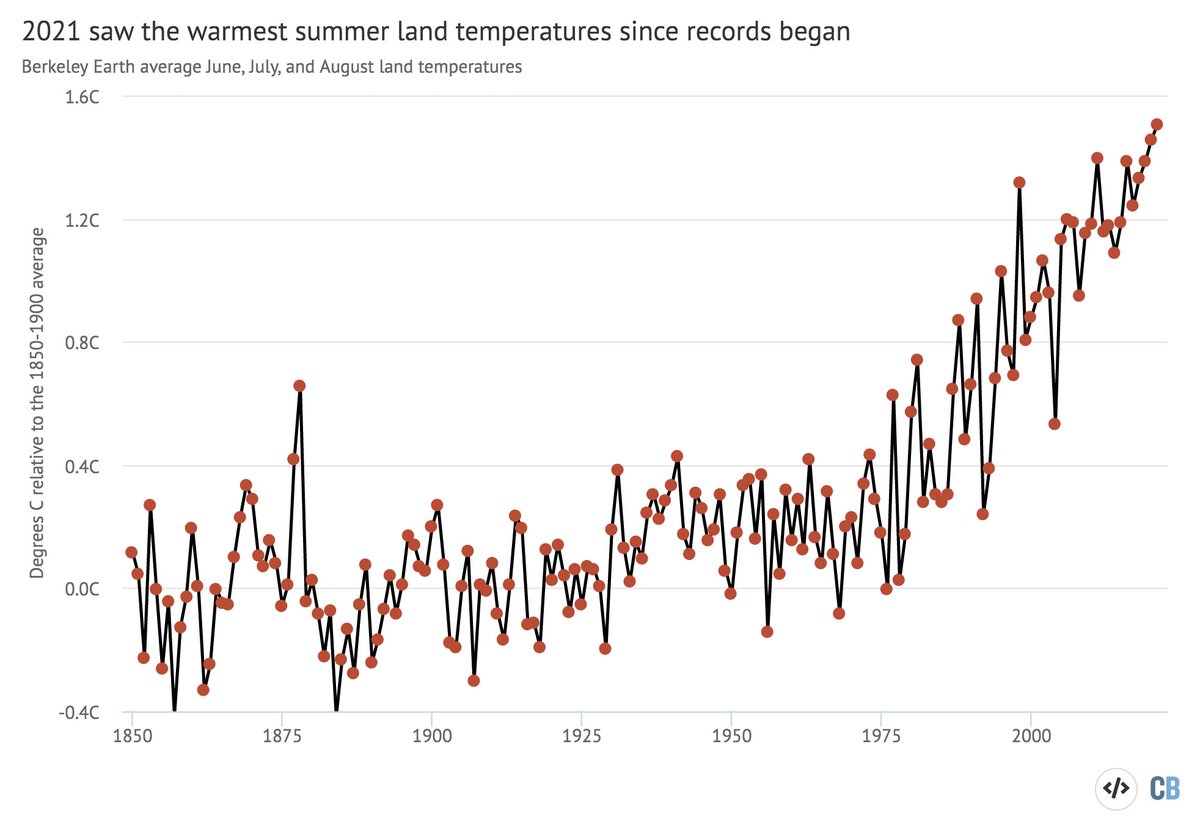
2021 saw the warmest summer for the Earth's land regions, and is on track to be between the 5th and 7th warmest year since records began in the mid-1800s. For an update on temps, models, GHGs, and sea ice see our @CarbonBrief Q3 State of the Climate: carbonbrief.org/state-of-the-c… 

Summer land temperatures were relatively flat until 1975, with only around 0.2C warming up to that point. Today, summer land temperatures are around 1.5C above pre-industrial levels, with around 1.3C of that warming happening in just the past 45 years. 

NW North America, Eastern Europe, Middle East, Northern Africa, and Siberia all had an exceptionally warm summer. China, sub-Saharan Africa, South America and Australia were modestly above average, while parts of Central America and India were below average. 

The figure below shows the temperature anomalies – changes relative to the 1981-2010 average temperature – for each year since 1970, along with the average over the first nine months of 2021. 

So far, 2021 is tied for the 5th warmest to date with 2015 and 2018. It had a cooler start than those years, but warmer temperatures over the past few months have pushed year-to-date values upwards. However, there is a growing La Niña event in the tropical Pacific. 

The table below shows how each month in 2021 ranked across all the datasets examined – with “2nd” indicating the second warmest temperature on record for that month occurred in 2021. 

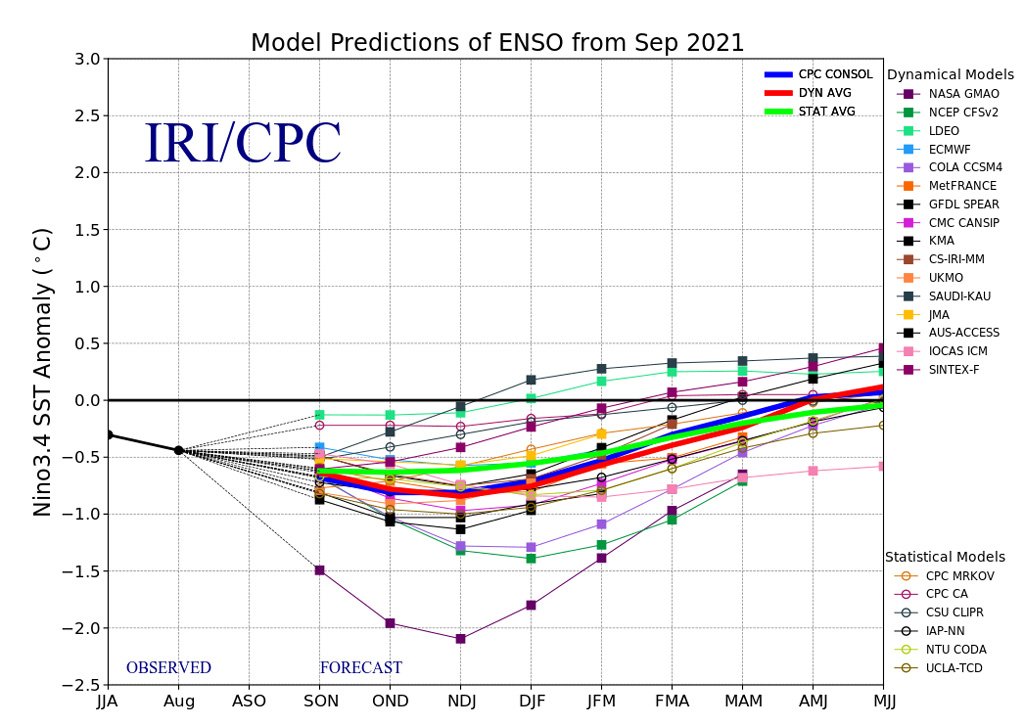
El Niño and La Niña events – collectively referred to as the El Niño Southern Oscillation, or ENSO – are the main driver of year-to-year variation on top of the long-term surface warming trend. El Niño years tend to be warmer than average, while La Niña years tend to be cooler.
La Niña conditions have played a role in cooler 2021 temps. Models now forecast modest-to-moderate La Niña conditions will persist through first quarter of 2022. This may result in 2022 being a bit cooler than the past few years as well, though it is too early to know for sure. 

Using the data from the first nine months of the year, plus both past and forecast future ENSO conditions, Carbon Brief has produced a prediction of where 2021 temps will most likely land for different surface temperature records. (Hadley/Berkeley will be added when available). 

The figure below shows the 2021 to-date temperatures and annual 2021 projected temperatures (with uncertainties) for Copernicus/ECMWF’s ERA5, along with the long-term temperature trend based on data from 1979-2020. 

While 2021 temperatures will be lower than many of the past few years, they are quite consistent with the longer-term warming trend due to human emissions of CO2 and other greenhouse gasses.
With each month of additional data, the uncertainty in the expected 2021 annual temps shrinks as there are fewer remaining months to change the average. The figure below illustrates this, showing that both the best estimate (red) and uncertainty range (black whiskers) over time: 

Global temperatures have been well in-line with climate model projections from the generation of models used in the IPCC 5th Assessment Report (CMIP5). We will be showing a comparison with the new warming projections in the AR6 in our year-end review. 

Human emissions of greenhouse gases have increased atmospheric concentrations of CO2, methane and nitrous oxide to their highest levels in at least a few million years – if not longer. 

Arctic sea ice extent was at low levels for much of the first half of 2021, setting new records in parts of both June and July. The summer minimum was the 12th lowest on record. Average Arctic sea ice to-date (first 289 days of the year) is the 9th lowest on record. 

For more details (and interactive charts and graphs!) see our Carbon Brief article: carbonbrief.org/state-of-the-c…
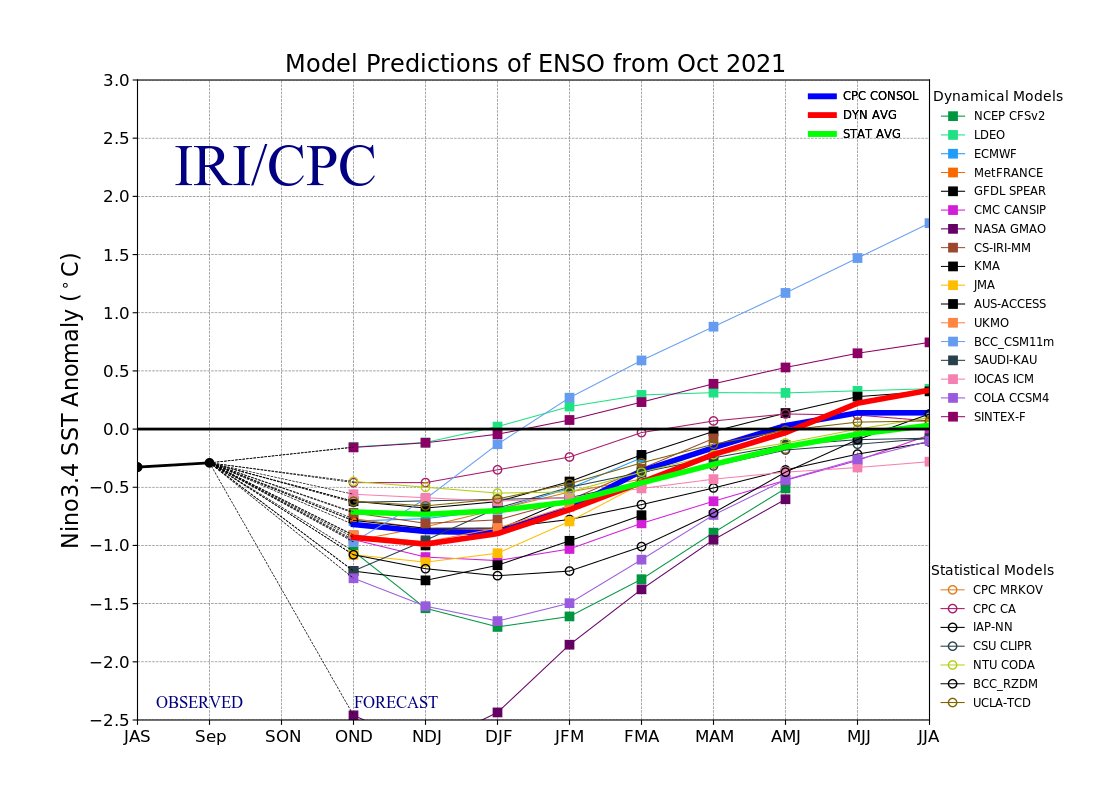
And literally an hour after I post this the October ENSO plume models are out. Still projecting a moderate winter La Nina:
https://twitter.com/hausfath/status/1450543707971719169
• • •
Missing some Tweet in this thread? You can try to
force a refresh


