(1/7) A quality control tool for raw #sequence data. Using #FastQC you may check:
🚀 Per base sequence #quality (do you see a drop in sequencing quality near the read end?). This view shows an overview of the range of quality across all bases at each position in the FASTQ file.
🚀 Per base sequence #quality (do you see a drop in sequencing quality near the read end?). This view shows an overview of the range of quality across all bases at each position in the FASTQ file.

(2/7) Per sequence quality scores (how many reads are the best?) The per sequence quality score report shows whether a subset of sequences has universally low-quality values. 

(3/7) Per base sequence content (the proportion of each base position in a file for which each of the four normal #DNA bases has been called). Ideally, in a random library, we would see four parallel lines representing the relative base composition. 

(4/7) Per sequence GC content (measures the #GC content across the whole length of each sequence). For data of good quality, the graph will show a normal, 🔔bell-shaped distribution. 

(5/7) Sequence length distribution. This module generates a graph showing the #distribution of #fragment sizes in the file that was analyzed. Some high-throughput #sequencers generate sequence fragments of uniform length, but others can contain #reads of wildly varying lengths. 

(6/7) Sequence duplication levels. This module counts the degree of #duplication for every sequence in the set and creates a plot showing the relative number of sequences with different degrees of duplication. A high level of duplication is more likely to indicate enrichment bias 

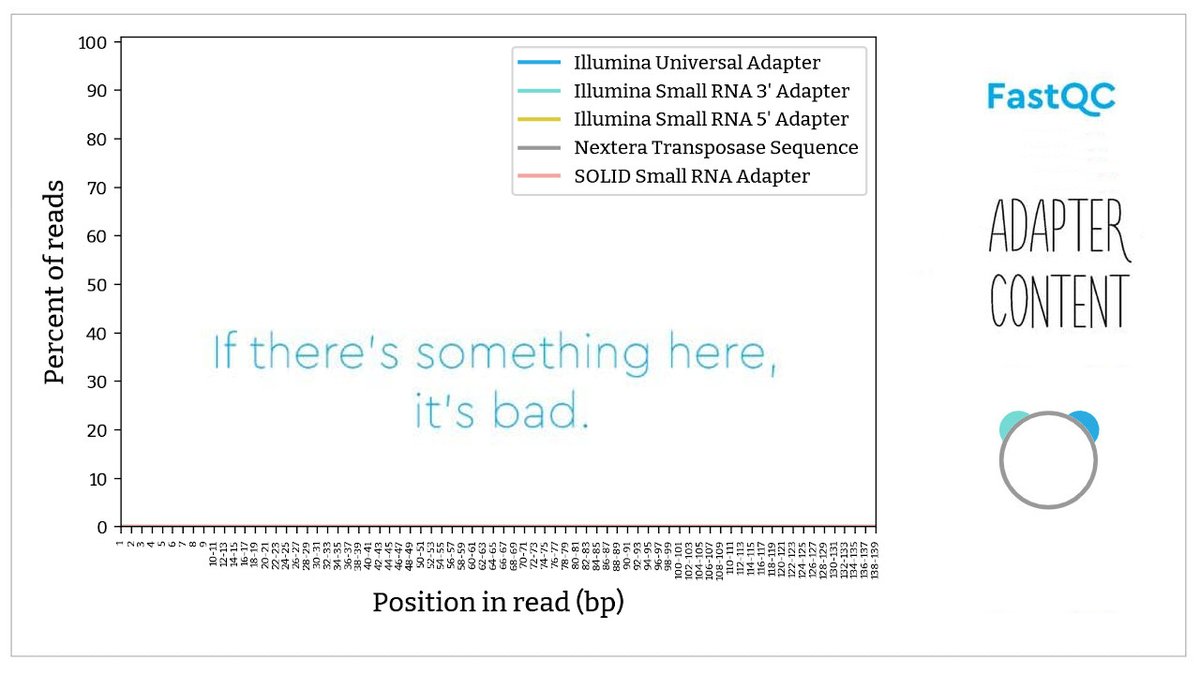
(7/7) Adapter content (did you remove all #adapters before processing?). The sequence #library adapter sequence is identified at the indicated base position.
bioinformatics.babraham.ac.uk/projects/fastq…
bioinformatics.babraham.ac.uk/projects/fastq…

• • •
Missing some Tweet in this thread? You can try to
force a refresh


