A side-story to this (very welcome) news:
Calculating global fossil-fuel emissions is something a numerate teenager can do on a laptop.
Calculating global land-use emissions? We're mostly just staggering around in semi-darkness.
Calculating global fossil-fuel emissions is something a numerate teenager can do on a laptop.
Calculating global land-use emissions? We're mostly just staggering around in semi-darkness.
https://twitter.com/hausfath/status/1456048962012471301
We know how much carbon there is in fossil fuels and how much CO2 they produce when burned. These are global commodities whose production volumes are well-known.
Multiply the two and you have a good-enough number for FF emissions. The best analysis merely refines this sum.
Multiply the two and you have a good-enough number for FF emissions. The best analysis merely refines this sum.
Whereas calculating land-use emissions involve multiple calculations about the carbon cycles of different ecosystems, and how those ecosystems link up, and are being changed by climate change itself, etc. etc. There's an awful lot that we don't know in all of this!
One reason that trees have become the gold standard for land-use carbon management -- the reason there was a deforestation deal at @COP26, rather than one on carbon-fixing in grasslands or wetlands etc -- is just that trees are the bit of ecosystems which we understand best.
@COP26 We've in a sense been calculating the above-ground carbon stock of forests since the middle ages, because forestry management is basically calculating the age and volume of wood in a forest. This is an old established science with visible results -- the volume of timber produced.
@COP26 But the below-ground carbon stock of forests -- in root systems, fungus, and other flora and fauna -- may be just as important, and we really know very little about it. Not to mention in other ecosystems.
@COP26 If, as we hope, fossil fuel emissions go into sharp decline over the coming decades, it's going to be even more crucial that we have a good idea of what's going on in terms of land-use change.
@COP26 This recent study estimated that about 42% of all the biomass on earth is below the ground.
There's 130bn tonnes of plant roots and 100bn tonnes of soil microbes. Every animal on the land and in the sea sums to just 2bn tonnes.
pnas.org/content/115/25…
There's 130bn tonnes of plant roots and 100bn tonnes of soil microbes. Every animal on the land and in the sea sums to just 2bn tonnes.
pnas.org/content/115/25…

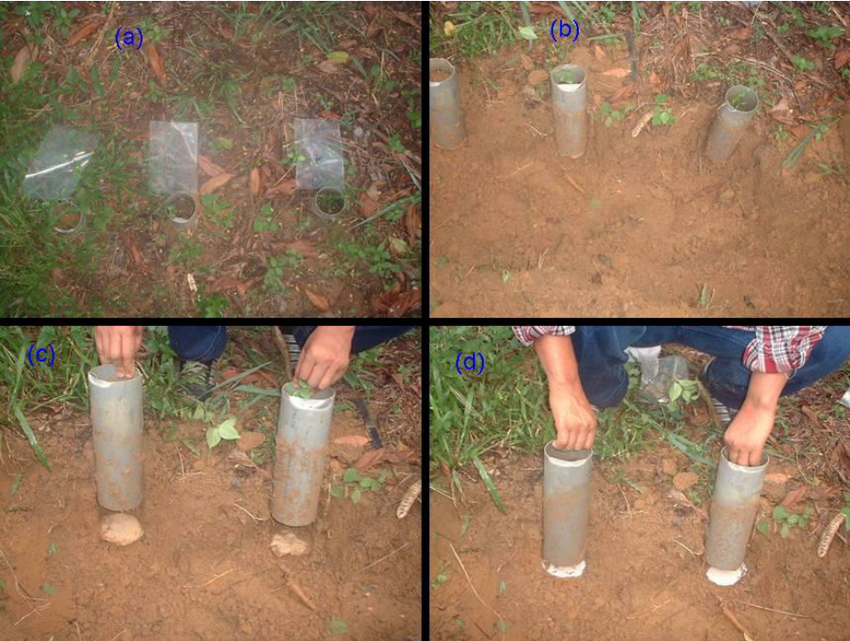
@COP26 We know very, very little about that 230 billion tons of below-ground biomass. Just calculating how much there is involves burying nylon bags or tubes of sand in the ground for 12 months and burning them, to calculate how much organic material was consumed. 

@COP26 That is, to say the least, an inexact science!
• • •
Missing some Tweet in this thread? You can try to
force a refresh


