High European gas prices has many reasons but one factor seems to be Gazprom's low storage fill in Europe. Is that really true? Let us look at the facts of @Gazprom's storage situation in Europe. 1/...
Friendly reminder: The EU imports 33% of its natural gas consumption from Russia, i.e. Gazprom! So if gas is short in Europe, Gazprom does matter. 2/...
So can we measure the storage percentage fill of Gazprom? Yes, once we identified its locations. Specifically, they are Rehden, Etzel, Jemgum, Katharina in Germany, Haidach in Austria, Bergermeer in NL, Damborice in Czech & Banatski Dvor in Serbia. 3/..
Source: Gazprom
The result: Gazprom storage in Western Europe is 24.6% filled as of 5/11/2021. As they say: thanks for nothing!
Note: we do not have data for Serbia & Czech. But it is irrelavant. The big 3 - Rehden, Haidach & Bergermeer matter. 4/...
How do the "big 3" screen for seasonality?
Rehden: 9.4%
5/..
Haiden (Austria): 2%
Pro Memoria: Austria is the gas hub of Central & Eastern Europe - 80 million people.
6/...
Bergermeer (Netherlands): 30%
Pro Memoria: The Netherlands are the gas hub of Western Europe (TTF = Title Transfer Facility) = (Henry Hub role in US). Think: what happened when Cushing wasn't able to clear last spring etc.
7/..
Which leads me to Groningen which produes at constrained 8.5bcm in 2021; capable of 20bcm? Size of EU gas market: 470bcm in 2019, ie 4.2%? This SWING producer (like Ghawar) must continue geopolitically. Period. 8/
Counting on more LNG imports? Well, LNG is highly sought after globally. As the global link of local markets, it accelerates gas price convergence. LNG is already 50% of global gas trade & will continue to grow as long as China tries to replace its coal input.
9/...
Having doubts on price convergence? Since January 2020, Asian LNG prices (quotes as JKM or Japan-Korea Cargo Swaps) have basically converged with EU TTF prices. The link? LNG imports. 10/..
Source: Burggraben analysis; Bloomberg
Of course, other factors mattered too. For instance EU regulators. They pushed to abandon Oil-Gas Linked contracts during times of high oil prices (pre-2014) to protect consumers. Result: Gazprom trades 80% GOG - Gas to Gas Price today (i.e. by d/s market forces). 11/...
End of thread. Please share. Thx
• • •
Missing some Tweet in this thread? You can try to
force a refresh
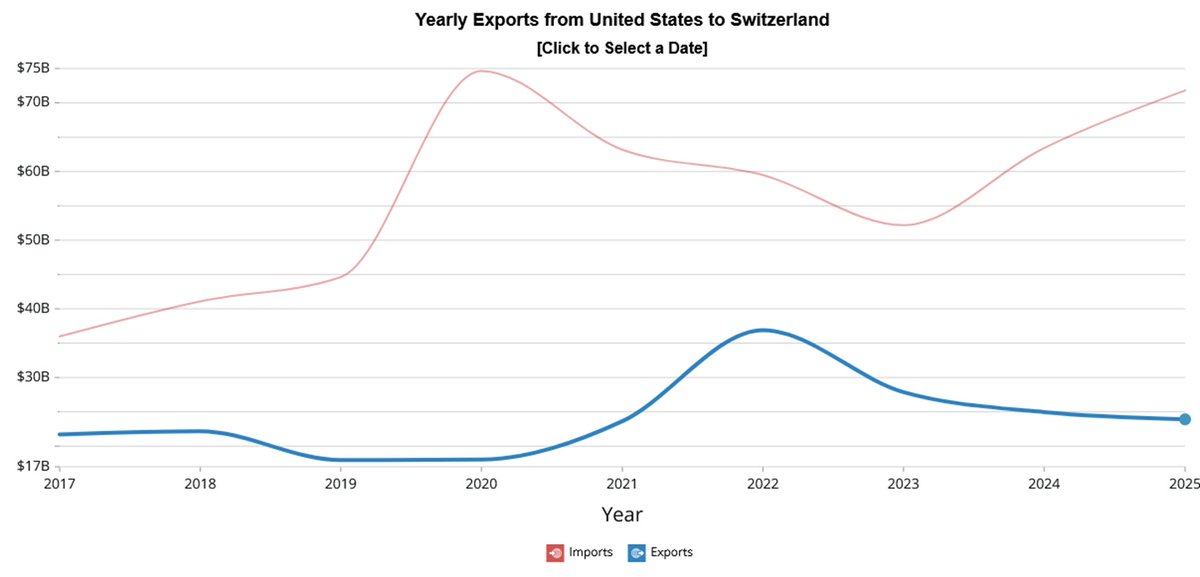
Let me add a few more facts & figures and some high level observations about the United States goods trade deficits with Switzerland of some $20bn annually.
The Swiss government and certain companies have little reason to lament—these tariffs were foreseeable.
Yes, the real issue is their scale: 39% compared to Europe’s 15%, which clearly puts some Swiss exports at a competitive disadvantage. It is what it is.
And while I still believe this situation is fixable, we must be prepared for the worst-case scenario to persist—or even worsen, with potential new tariffs on pharmaceuticals (currently exempted).
So, who is at fault? As some of us learned in officer school during military service: the Bundesrat misjudged the fundamentals of strategic assessment—Lagebeurteilung (judgement of enemy situation). That needs to be addressed. Trump wants balanced trade. Address it. Period.
History is not kind to those who choose dreams over reality—or to the weak who paint themselves as victims.
Therefore, whether Trump’s trade deficit logic makes any sense whatsoever (which it clearly doesn't in the Swiss case) is beside the point.
He’s the president. He has communicated his views clearly and consistently for decades. Adapt. Take the man seriously.
Trustworthy or not, as lamented by President Keller Sutter is none of our business.
2/n @SecScottBessent @BobgonzaleBob
Let’s now take a closer look at Switzerland’s goods trade surplus with the United States.
At Burggraben, we rely on the OEC tool (a paywalled MIT spin-off) for robust global trade data as part of our investment analysis process of all sorts—so we can assess this with confidence. I hope our readers will appreciate the data quality shared herewith for free.
While the annual trade surplus has fluctuated in recent years, the underlying—or let’s call it intrinsic—gap consistently hovers around $20 billion, as the data below will show.
More concretely, Iran likely enriched some 250kg of HEU stockpiles since 2021. Worse, it also said to adds significant new capacities.
That material so far could quickly be turned into the fuel for the equivalent of 10 bombs, should Iran’s leadership take the political decision to pursue weapons, according to Bloomberg.
Here is my theory how the major incident - a so called blackout - occurred at 12:30 CET today in the power system of Spain & Portugal:
1/n
At the time of the incident, Spain and Portugal operated the grid at very high renewables share of about 66% - i.e solar (55%) and wind (11%; eolica)
2/n
While this isn’t unusual for Spain, it does mean that the grid operates with little inertia (resistance to change) during such time. The grid is therefore vulnerable to external effects…!
On this platform, certain perma bulls keep pushing a bullish crude narrative based on relative U.S. inventories—day after day, for three years now.
Their logic: Total U.S. crude inventories (including the SPR) are at 838 million barrels (orange line), 200 million barrels below the 10-year average → bullish!
Yet, inventories keep falling, and prices remain stuck in a range. Clearly, they are wrong.
1/9 @UrbanKaoboy @Iris62655179 @BrentRuditLeo
The problem with their logic?
a) The U.S. is no longer the marginal importer of crude oil—Asia is (or was).
b) U.S. inventories are artificially high on a 10-year average due to the shale boom, which took off in 2014. Shale growth and Covid distort the data, keeping inventories (ex SPR) elevated. So any 5- or 10-year comparison is meaningless—period.
2/n US Crude Oil Inventory ex SPR
Including SPRs, the picture looks more normalised - but not tight. But does the US really need 700mb of strategic reserves in 2025? I don't think so.
Yesterday, I shared a few thoughts that I’d like to expand on, especially given how volatile the current tariff landscape under this admin has become.
Navigating it isn’t just difficult—it’s nearly impossible to avoid missteps. Hopefully some traders will expand on my thoughts...
1/n
What do we know?
As at 23 March 2025, Comex copper price in New York is trading at 14% premium to LME in London. Buying a tonne of copper in NY costs $11,213 versus 9,842 in London, $1,371 per tonne more than in London.
2/n
Why is that? Because of tariff FEARS, not tariffs.
Traders are hedging future risk of potential tariffs on all forms of the raw material, such as cathodes, concentrates, ores, and even scrap. But there aren't such tariffs in place for copper yet (unlike alumnium).
The current Comex price action in the U.S. is basically a Trump tariff trade mirage and is otherwise as misleading of fundaments as the May 2024 price action of which I warned on multiple occasions.
1/n $/pound
In May 2024 however, U.S. price action was more in synch with London. But it didn't reflect weak Chinese housing & construction fundamentals which has been 15-30% of GLOBAL copper use for the past two decades. Today, U.S. prices trade as if borders close tomorrow.
2/n Comex - LME arb in $/t
Unlike May 2024, copper blue chips like $FCX, however, do not buy the rally. So at least it seems that the equity market understands the tariff aspect of the copper price mirage.