11/11 Texas C19 Update
THREAD:
* Declines are slowing/flattening
* Winter wave watch continues
* Panhandle appears to be very flat to slowing rising
* El Paso rise is slowing somewhat
* Southern half of state continues steep decline
1/n
.
THREAD:
* Declines are slowing/flattening
* Winter wave watch continues
* Panhandle appears to be very flat to slowing rising
* El Paso rise is slowing somewhat
* Southern half of state continues steep decline
1/n
.
https://twitter.com/therealarod1984/status/1457817759899865090
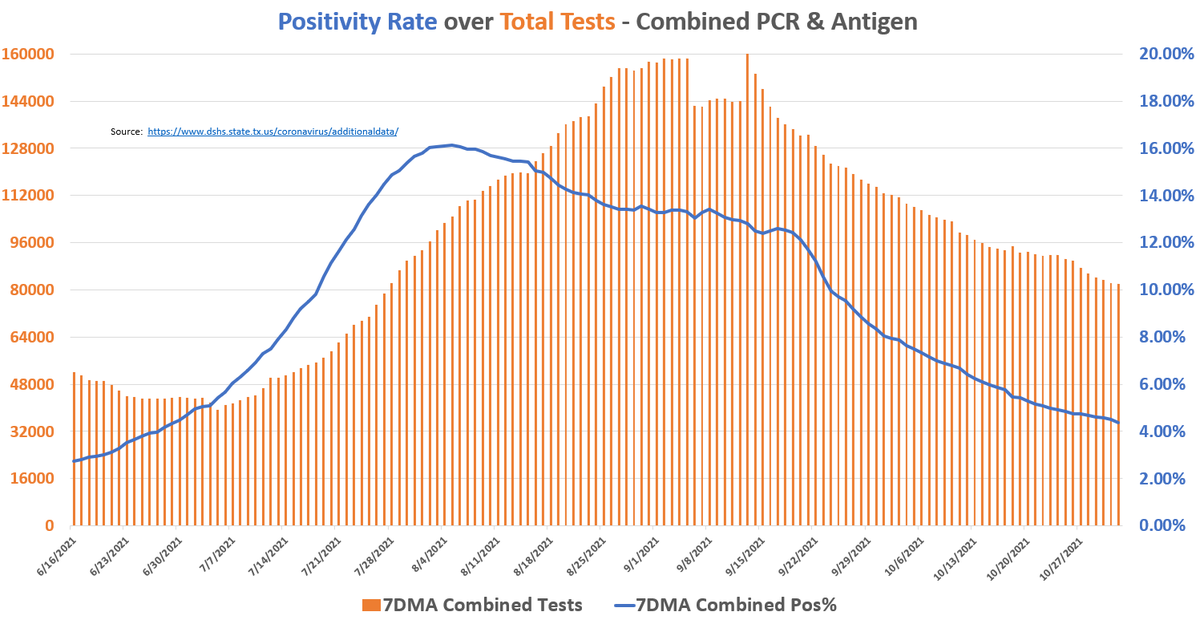
11/11 Testing
* Remember, tests are filed by date of specimen collection
* Anything < 7-8 days old is incomplete
* Pos% continues decline, 4.39% as of 11/1
* Testing declines to @ 574K per week as of 11/1
* Positive Test 7DMA below 3600 per day
* Covidestim Rt - 0.58
2/n
* Remember, tests are filed by date of specimen collection
* Anything < 7-8 days old is incomplete
* Pos% continues decline, 4.39% as of 11/1
* Testing declines to @ 574K per week as of 11/1
* Positive Test 7DMA below 3600 per day
* Covidestim Rt - 0.58
2/n


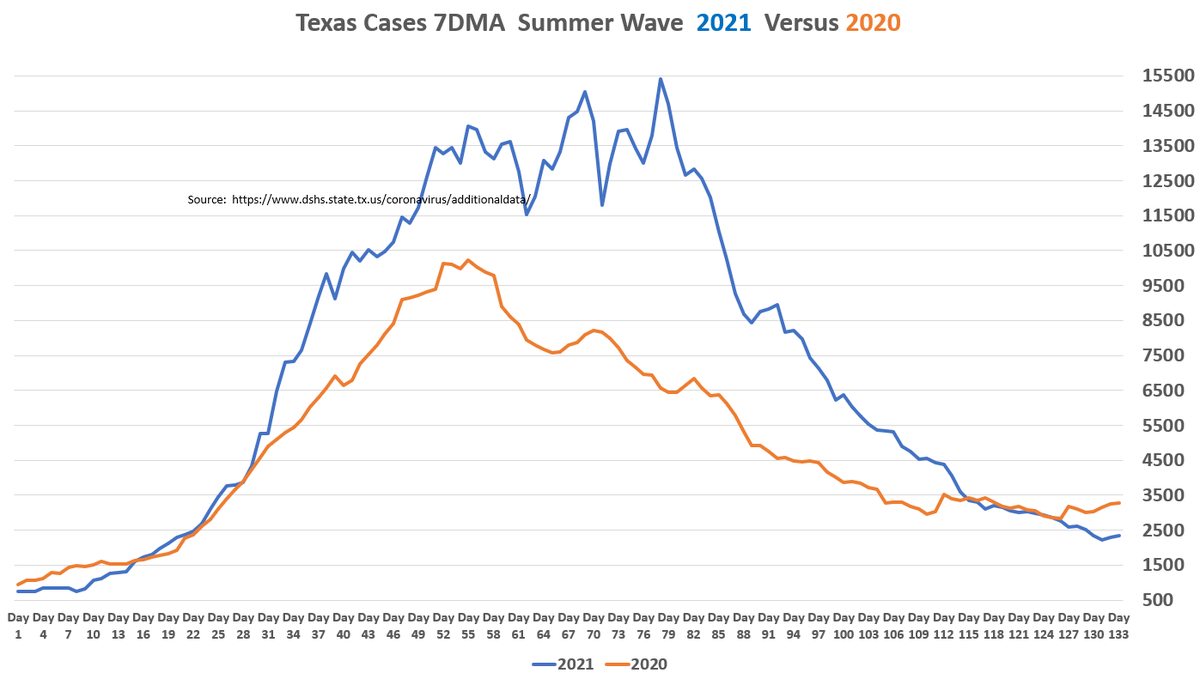
11/11 - Cases
* Cases have flattened out in the past few days
* Looking at the more recent, incomplete testing numbers per 2/n, not seeing same yet
* Cases are batched by date received by the county
* 7DMA of 2384 cases, declining 5% week over week
* Will watch
3/n
.
* Cases have flattened out in the past few days
* Looking at the more recent, incomplete testing numbers per 2/n, not seeing same yet
* Cases are batched by date received by the county
* 7DMA of 2384 cases, declining 5% week over week
* Will watch
3/n
.


11/11 Hospitalizations - Part 1
* Covid Admits 7DMA flat. 317 per day 7DMA
* % of beds tagged as Covid down to 4.21%, with a total Covid census of 2717 beds
* 7DMA WoW rate of decline slowing to 16.2%
* See link below for looks at ELP, AMA, LBB
4/n
.
covid-texas.csullender.com/?tsa=I
* Covid Admits 7DMA flat. 317 per day 7DMA
* % of beds tagged as Covid down to 4.21%, with a total Covid census of 2717 beds
* 7DMA WoW rate of decline slowing to 16.2%
* See link below for looks at ELP, AMA, LBB
4/n
.
covid-texas.csullender.com/?tsa=I


11/11 Hospitalizations - Part 2
* ICU portion of the bed census is down to 955
* Comments in 11/8 update suggested looking at New Mexico. NMs winter waves definitely start before TX both years
* Could explain ELP and Panhandle
* NM is in a rise now. TX next? Well see
5/n
.
* ICU portion of the bed census is down to 955
* Comments in 11/8 update suggested looking at New Mexico. NMs winter waves definitely start before TX both years
* Could explain ELP and Panhandle
* NM is in a rise now. TX next? Well see
5/n
.


11/11 Conclusion
* Definite flattening this week in Cases and Hosp Admits
* Positive Tests and Hospital census still in decline
* New Mexico in a wave, may be affecting areas near NM border.
* Will be interested to see what next 3-4 days look like
6/n
* Definite flattening this week in Cases and Hosp Admits
* Positive Tests and Hospital census still in decline
* New Mexico in a wave, may be affecting areas near NM border.
* Will be interested to see what next 3-4 days look like
6/n
• • •
Missing some Tweet in this thread? You can try to
force a refresh