Honestly not a big fan of the case trends in the last couple of days. Here’s the overview: with the kids still driving the growth, but other groups also starting to pick up. (and I wouldn’t take too much cope from the flattening on the last day – that will get revised up) 🧵
Looking in more detail at the under-20s, we can see the power coming from the 5-9s, but with 0-4 and 10-14 not far behind, and even 15-19s now back into positive territory (i.e. cases growing)
In the 20-40s, cases now also (gently) growing:
A very consistent trend in the middle-aged groups, with increasing rates of growth:
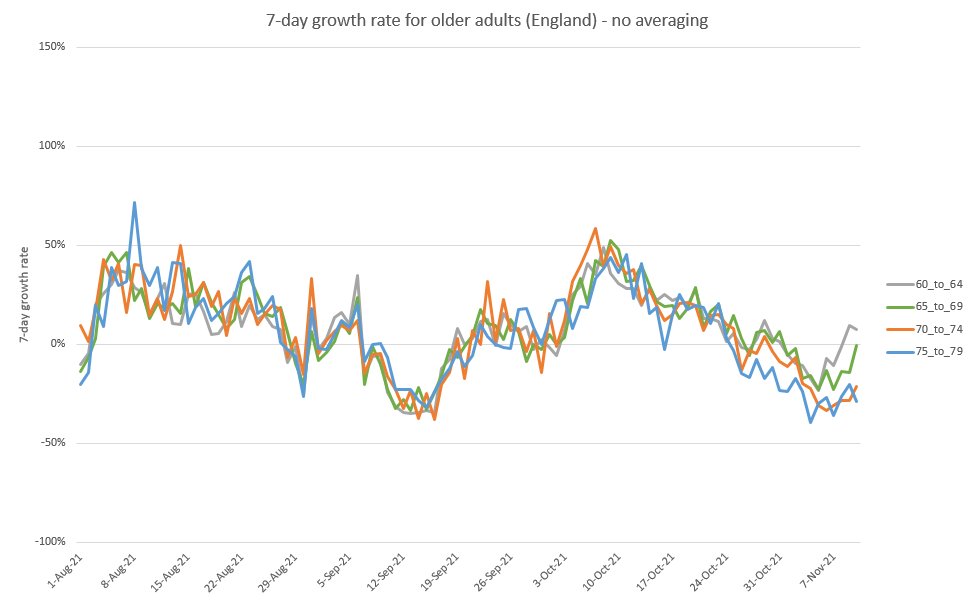
And we now see 60-64 returning to growth, and 65-69 looking like it will get there soon. We really need to get more boosters in those arms, and fast. Fortunately 70-79s (where booster rates are already high) are looking OK, with cases still declining.
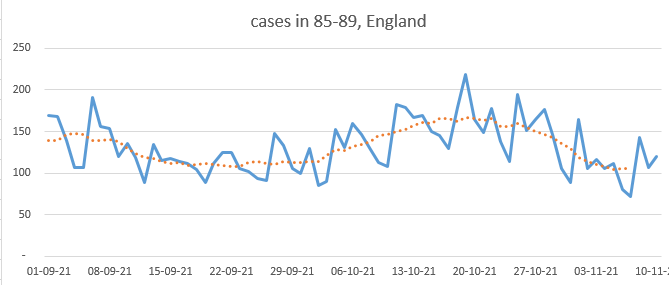
But what’s going on here, with 85-89 and 90+ both back in growth. They've already have good rates of boosters, so is it spreading in the unboosted?
It’s not a big shift (as you can see in the raw case data here for the 85-89), and some of it could just be noise, but it does look like the downward trend has been interrupted. And that’s not great news for hospitalisations next week.
Still, as the bunny says, we should probably wait a few days before jumping to conclusions. I'm going back to watching the rugby now (go England!), but I'll be keeping a close eye on this too over the next few days. /end
sorry, managed to break the thread here:

• • •

Missing some Tweet in this thread? You can try to force a refresh
 

Keep Current with James Ward

James Ward Profile picture

Stay in touch and get notified when new unrolls are available from this author!

Read all threads

This Thread may be Removed Anytime!

PDF

Twitter may remove this content at anytime! Save it as PDF for later use!

Try unrolling a thread yourself!

how to unroll video
  1. Follow @ThreadReaderApp to mention us!

  2. From a Twitter thread mention us with a keyword "unroll"
@threadreaderapp unroll

Practice here first or read more on our help page!

More from @JamesWard73

11 Nov
The headlines from today’s case data are concerning, and it’s certainly not great news. But there are some glimmers of hope in the detail by age, so let’s have a dig in. The overview doesn’t look too bad, with case rates stable in the under-40s, and still falling in the 40+ 🧵 Image
But that is a slightly lagged view of what’s going on, and obscures some useful detail. So I’ve built some new graphs which break down each of those lines into 5-year age groups, with no averaging, and using data up to specimen date 9th Nov – NB this date will get revised up.
Here’s the under-20s, to start with – we can see growth re-emerging in the 5-9s and 10-14s, but not so much in the 15-19s. The 0-4s were already bouncing around, close to stability – and that looks to be continuing here. Image
Read 12 tweets
3 Nov
The case trends remain hard to read, but with a bit of age-group case ratio analysis, I think we can see a bit further into the fog. Let’s start with the overview: cases still falling in the under-20s and over-60s, but not the 20-60s. But that hides some important detail. 🧵 Image
Looking first at the older (60+) age groups., we can see some very steep (and welcome) declines in the 75+, a gentle decline in the 70-74s, and gentle increases in the 60-69s. Exactly what you might expect if we were giving boosters to the most elderly first, for example. Image
So – good news overall. But also a reminder that if we leave the 60-69s unboosted for too long, we might see those case rates drift upwards, which would be very unhelpful.
Read 15 tweets
30 Oct
There been something bugging me for a while about how my model (and others) works. And I think I’ve finally pinned it down. It’s subtle and technical, but I think might turn out to be surprisingly important. And it’s all to do with the “leakiness” of the immunity model. 🧵
The difference between a “leaky” vaccine and an “all-or-nothing” vaccine has been well-covered by others – my favourite explanation is in this thread:
As it happens I’m not particularly happy with the “leaky” terminology – it could mean a number of different things, and so could be misinterpreted. I prefer to think about this in terms of the variability of the vaccine effectiveness (VE) at individual level.
Read 25 tweets
29 Oct
I’ve been thinking a bit about optimism and pessimism, and how that might affect our views on whether additional restrictions (such as the government’s “Plan B”) should be imposed. It’s not quite as simple as it might first appear. Let me explain…. 🧵
The first thing to note is that optimism and pessimism can operate on different timescales. So you might think that things are going to get worse over the next couple of months, but that 2022 will be a more positive experience, due to boosters and improved treatments.
Or you might be relatively optimistic about the next couple of months, but concerned about the potential for a resurgence in early 2022 as we reach the depths of midwinter, and as waning immunity hits the populations in their 40s and 50s who may not have had a booster yet.
Read 12 tweets
28 Oct
It’s been a while since we’ve had a set of SPI-M models and it’s taken me a few days to read through them properly. Having done so, I have a few thoughts – as usual I’ve found 10 key messages to take away. For reference, the papers are all here: gov.uk/government/col… 🧵
In terms of overall messages, I would agree with everything that @BristOliver said here: . So I’ll focus my own comments more in the detail of how the modelling has been done, and its implications.
1) In general, the models are fairly optimistic about the course of the next 2 months, but after that they vary a lot – with some scenarios showing significant peaks in 2022 (at any time from January through to June) and others with no big resurgence
Read 16 tweets
27 Oct
The news from today’s case data continues to be good, but because I can only do undiluted positivity for so long before providing some balance, I’m going to give you the good news quickly, and then give you four reasons to avoid premature celebrations.
First, the good news: case growth in school-age kids continues to decline, and even more quickly in the last day or two. (note: this latest cliff-edge is undoubtedly exaggerated by the impact of people doing fewer LFD tests last weekend, as half term started for most kids)
In particular we can see the 10-14s now clearly over a peak: (best to look at that orange dotted line, which is a 7-day centred average, for an indication of the trend)
Read 15 tweets

Did Thread Reader help you today?

Support us! We are indie developers!


This site is made by just two indie developers on a laptop doing marketing, support and development! Read more about the story.

Become a Premium Member ($3/month or $30/year) and get exclusive features!

Become Premium

Too expensive? Make a small donation by buying us coffee ($5) or help with server cost ($10)

Donate via Paypal

Thank you for your support!

Follow Us on Twitter!

:(