ULTIMATE GUIDE TO 21 and 200 Moving Average
SUNDAY THREAD 🔖
A trend Following System That will Help You Improve Trading immensely.
RETWEET AND SHARE 🔄
@kuttrapali26 @AmitabhJha3
#stocks #StockMarket
1/n
SUNDAY THREAD 🔖
A trend Following System That will Help You Improve Trading immensely.
RETWEET AND SHARE 🔄
@kuttrapali26 @AmitabhJha3
#stocks #StockMarket
1/n
Moving averages
EMA and SMA
1. Exponential Moving Average (EMA) is similar to Simple Moving Average (SMA), measuring trend direction over a period of time.
2. However, whereas SMA simply calculates an average of price data, EMA applies more weight to data that is more current
2/
EMA and SMA
1. Exponential Moving Average (EMA) is similar to Simple Moving Average (SMA), measuring trend direction over a period of time.
2. However, whereas SMA simply calculates an average of price data, EMA applies more weight to data that is more current
2/

21 EMA : SHORT TERM TREND
1. Calculates the Average Price of past 21 days
2. A stock above 21 ema is in strong momentum , which will give pullbacks to 21 ema again and again.
3. Stock above 21 ema should never be shorted so as to stay with the trend
3/n
1. Calculates the Average Price of past 21 days
2. A stock above 21 ema is in strong momentum , which will give pullbacks to 21 ema again and again.
3. Stock above 21 ema should never be shorted so as to stay with the trend
3/n
3. A stock which moves 10-15% above 21 ema will be too extended and hence will generally pullback
Stocks take dynamic support on 21 ema
4. You can Short only if its too extended like 15 to 20% from 21 ema ( Not advised )
#ADANIPOWER:
#pnbhousing
4/n

Stocks take dynamic support on 21 ema
4. You can Short only if its too extended like 15 to 20% from 21 ema ( Not advised )
#ADANIPOWER:
#pnbhousing
4/n


1. Whenever 21 ema is sloping upwards its called uptrend
2. Whenever 21 ema is sloping downwards its called dowtrend
3. Whenever 21 ema is sideways its called consolidation
⏫Buy in uptrend
⏬Sell in downtrend
Examples:
5/n


2. Whenever 21 ema is sloping downwards its called dowtrend
3. Whenever 21 ema is sideways its called consolidation
⏫Buy in uptrend
⏬Sell in downtrend
Examples:
5/n


Use this simple trend following system to buy and sell stocks
Helps you to identify reversal in trend
Works well in trending market and trending stocks
Ideal place to sell a stock is its moved more than 15% away from 21 ema
Risk increases the farther you buy from 21 ema
6/n

Helps you to identify reversal in trend
Works well in trending market and trending stocks
Ideal place to sell a stock is its moved more than 15% away from 21 ema
Risk increases the farther you buy from 21 ema
6/n


200 EMA : THE LONG TERM TREND
1. When a stock price crosses its 200-day moving average, it is a technical signal that a reversal has occurred.
2. A stock above 200 ema is considered bullish in its long term trend and if its below 200 ema its considered bearish
7/n
1. When a stock price crosses its 200-day moving average, it is a technical signal that a reversal has occurred.
2. A stock above 200 ema is considered bullish in its long term trend and if its below 200 ema its considered bearish
7/n
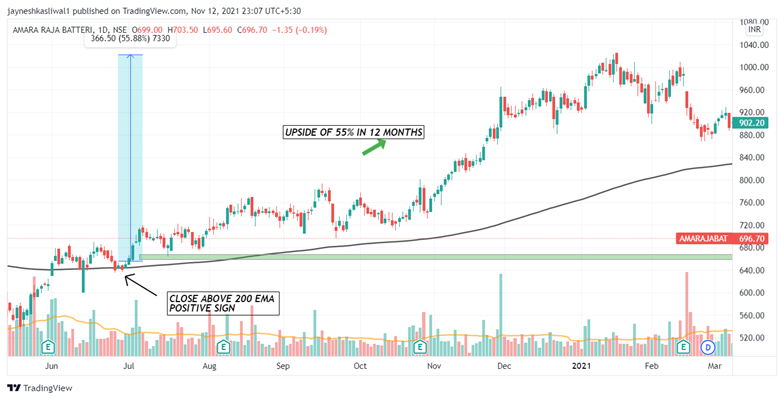
3. A simple rule of not buying stocks below 200 ema for short term trading could save a lot of money
4. One may consider investing in stocks if the stock is below 200 ema only if he is confirmed about the fundamentals of the stock
5. Some may not agree with this and its ok!
8/n
4. One may consider investing in stocks if the stock is below 200 ema only if he is confirmed about the fundamentals of the stock
5. Some may not agree with this and its ok!
8/n

The 200 ema helps to identify where the market breath is
During the corona crash if the simple system was used you would have saved 35% drawdown in your account
Using 200 ema beats the buy and hold strategy which over the years haven been proved in book
200 ema THE SAVIOUR :
10/

During the corona crash if the simple system was used you would have saved 35% drawdown in your account
Using 200 ema beats the buy and hold strategy which over the years haven been proved in book
200 ema THE SAVIOUR :
10/


WEEKLY 200 EMA : VERY LONG TERM VIEW:
1. If you use 200 ema on weekly timeframe you can be in a trend for a very long time
2.The sell signs will be given late as we are using weekly timeframe
11/n
1. If you use 200 ema on weekly timeframe you can be in a trend for a very long time
2.The sell signs will be given late as we are using weekly timeframe
11/n
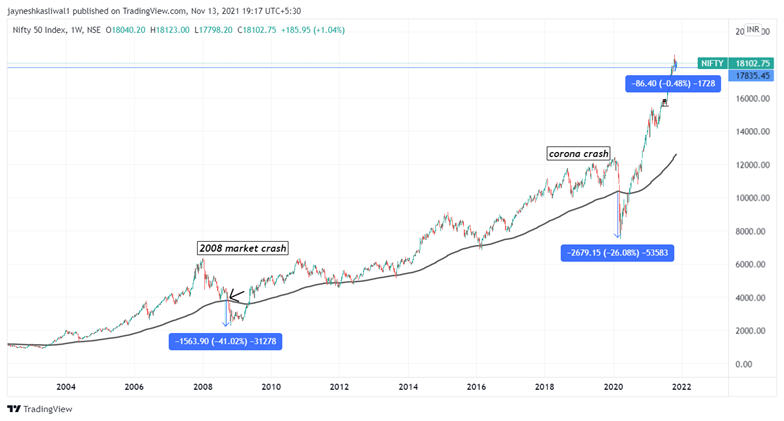
3. You will have bigger drawdown compared to daily time frame
4. Weekly timeframe will give less signals while daily timeframe will give lot of whipsaws during sideways trend .
12/n
4. Weekly timeframe will give less signals while daily timeframe will give lot of whipsaws during sideways trend .
12/n
LONG TERM INVESTING WITH 200 EMA
MULTIBAGGER:
#infy #britannia
Most multibagger stocks will stay above weekly 200 ema and take support on that
These are strong fundamental stocks which will outperform the market
Laggards will stay below 200 ema and hence should be avoided.
13/n

MULTIBAGGER:
#infy #britannia
Most multibagger stocks will stay above weekly 200 ema and take support on that
These are strong fundamental stocks which will outperform the market
Laggards will stay below 200 ema and hence should be avoided.
13/n


HOW TO SAVE YOURSELF FROM MULTIBEGGARS:
#yesbank and #idea .
A simple Criteria Not to buy stocks below 200 ema for long term investing will help you rise multibaggers
If you let your emotions out and be systematic traders this could change your trading
14/n
END

#yesbank and #idea .
A simple Criteria Not to buy stocks below 200 ema for long term investing will help you rise multibaggers
If you let your emotions out and be systematic traders this could change your trading
14/n
END


Hope you liked it and if you want to have the pdf please use the link below
app.cosmofeed.com/view_group/618…
@caniravkaria @MarketScientist
app.cosmofeed.com/view_group/618…
@caniravkaria @MarketScientist
• • •
Missing some Tweet in this thread? You can try to
force a refresh


